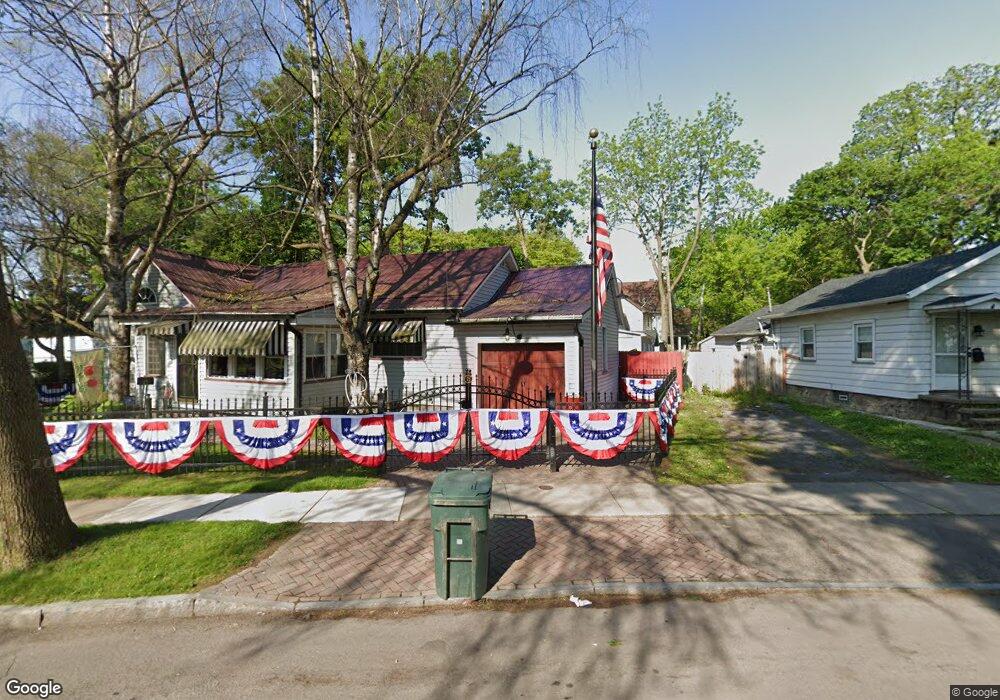
75 Fulton Ave Rochester, NY 14608
Brown Square NeighborhoodEstimated Value: $93,000 - $117,172
3
Beds
1
Bath
1,249
Sq Ft
$87/Sq Ft
Est. Value
About This Home
This home is located at 75 Fulton Ave, Rochester, NY 14608 and is currently estimated at $109,043, approximately $87 per square foot. 75 Fulton Ave is a home located in Monroe County with nearby schools including John Williams School No. 5, Enrico Fermi School No. 17, and Virgil Grissom School No. 7.
Ownership History
Date
Name
Owned For
Owner Type
Purchase Details
Closed on
Jul 22, 2004
Sold by
Greater Roch Partnshp Hsg
Bought by
Siemienkiewicz Donald F
Current Estimated Value
Purchase Details
Closed on
Oct 9, 2002
Sold by
Pittsford Capital Mortgag E Partners, Llc
Bought by
Greater Rochester Partner Ship Housing Develo
Purchase Details
Closed on
Mar 27, 2002
Sold by
Sky King Ltd
Bought by
Pittsford Capital Mtg Par
Purchase Details
Closed on
Sep 3, 1999
Sold by
J Ernie Corp
Bought by
Sky King Ltd
Create a Home Valuation Report for This Property
The Home Valuation Report is an in-depth analysis detailing your home's value as well as a comparison with similar homes in the area
Home Values in the Area
Average Home Value in this Area
Purchase History
| Date | Buyer | Sale Price | Title Company |
|---|---|---|---|
| Siemienkiewicz Donald F | $46,400 | -- | |
| Greater Rochester Partner Ship Housing Develo | $11,500 | Patrick Cusato | |
| Pittsford Capital Mtg Par | $10,000 | -- | |
| Sky King Ltd | $15,000 | Anthony Lafay |
Source: Public Records
Tax History Compared to Growth
Tax History
| Year | Tax Paid | Tax Assessment Tax Assessment Total Assessment is a certain percentage of the fair market value that is determined by local assessors to be the total taxable value of land and additions on the property. | Land | Improvement |
|---|---|---|---|---|
| 2024 | $399 | $67,800 | $4,400 | $63,400 |
| 2023 | $396 | $52,500 | $3,700 | $48,800 |
| 2022 | $644 | $52,500 | $3,700 | $48,800 |
| 2021 | $646 | $52,500 | $3,700 | $48,800 |
| 2020 | $621 | $52,500 | $3,700 | $48,800 |
| 2019 | $655 | $46,000 | $3,700 | $42,300 |
| 2018 | $1,023 | $46,000 | $3,700 | $42,300 |
| 2017 | $0 | $46,000 | $3,700 | $42,300 |
| 2016 | $655 | $46,000 | $3,700 | $42,300 |
| 2015 | $1,000 | $45,000 | $3,700 | $41,300 |
| 2014 | $1,000 | $45,000 | $3,700 | $41,300 |
Source: Public Records
Map
Nearby Homes