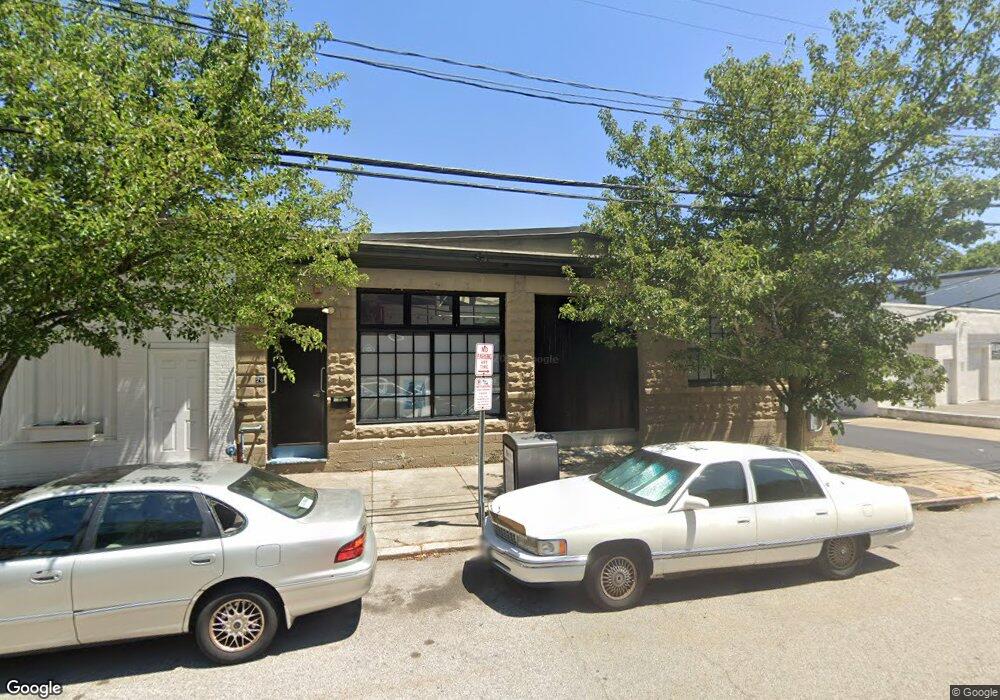
75 Montgomery St Pawtucket, RI 02860
Downtown Pawtucket NeighborhoodEstimated Value: $447,658
--
Bed
--
Bath
6,919
Sq Ft
$65/Sq Ft
Est. Value
About This Home
This home is located at 75 Montgomery St, Pawtucket, RI 02860 and is currently estimated at $447,658, approximately $64 per square foot. 75 Montgomery St is a home located in Providence County with nearby schools including International Charter School, Blackstone Academy Charter School, and Saint Raphael Academy.
Ownership History
Date
Name
Owned For
Owner Type
Purchase Details
Closed on
Sep 10, 2018
Sold by
Simpson Gretchen D
Bought by
Gretchen Dow Simpson R and Gretchen Simpson
Current Estimated Value
Purchase Details
Closed on
Jul 19, 2013
Sold by
Simpson Gretchen D
Bought by
Gretchen Dow Simpson R and Gretchen Simpson
Purchase Details
Closed on
Jan 10, 2005
Sold by
Maurice David A and Maurice Suzanne L
Bought by
Montgomery St Studios
Create a Home Valuation Report for This Property
The Home Valuation Report is an in-depth analysis detailing your home's value as well as a comparison with similar homes in the area
Home Values in the Area
Average Home Value in this Area
Purchase History
| Date | Buyer | Sale Price | Title Company |
|---|---|---|---|
| Gretchen Dow Simpson R | -- | -- | |
| Gretchen Dow Simpson R | -- | -- | |
| Montgomery St Studios | $250,000 | -- |
Source: Public Records
Tax History Compared to Growth
Tax History
| Year | Tax Paid | Tax Assessment Tax Assessment Total Assessment is a certain percentage of the fair market value that is determined by local assessors to be the total taxable value of land and additions on the property. | Land | Improvement |
|---|---|---|---|---|
| 2025 | $4,717 | $205,000 | $62,300 | $142,700 |
| 2024 | $4,428 | $205,000 | $62,300 | $142,700 |
| 2023 | $4,806 | $162,100 | $51,700 | $110,400 |
| 2022 | $4,704 | $162,100 | $51,700 | $110,400 |
| 2021 | $4,704 | $162,100 | $51,700 | $110,400 |
| 2020 | $5,750 | $166,800 | $51,700 | $115,100 |
| 2019 | $12,739 | $166,800 | $51,700 | $115,100 |
| 2018 | $5,539 | $166,800 | $51,700 | $115,100 |
| 2017 | $5,141 | $147,400 | $55,900 | $91,500 |
| 2016 | $4,954 | $147,400 | $55,900 | $91,500 |
| 2015 | $4,954 | $147,400 | $55,900 | $91,500 |
| 2014 | $5,565 | $180,200 | $60,700 | $119,500 |
Source: Public Records
Map
Nearby Homes
- 78 Barton St
- 396 Roosevelt Ave
- 75 Olive St
- 10 Exchange Ct Unit 203
- 10 Exchange Ct Unit 506
- 234 Central St Unit 236
- 511 High St
- 517 High St
- 300 Front St Unit 105
- 36 Underwood St
- 45 Harrison St
- 23 Garden St
- 30 Foundry St Unit 6
- 71 Lyon St
- 50 Carnation St Unit 2
- 116 Foundry St
- 168 Central Ave
- 29 Woodbine St Unit 6
- 176 Central Ave
- 31-33 Garfield St
- 9 Grant St
- 81 Montgomery St
- 10 Grant St
- 8 Grant St
- 204 High St
- 84 Montgomery St
- 200 High St
- 182 High St
- 188 High St
- 49 Montgomery St
- 228 High St
- 9 Manchester St
- 178 High St
- 47 Montgomery St Unit 1F
- 47 Montgomery St Unit 1M
- 47 Montgomery St Unit 3
- 12 Manchester St
- 14 Manchester St
- 232 High St
- 170 High St