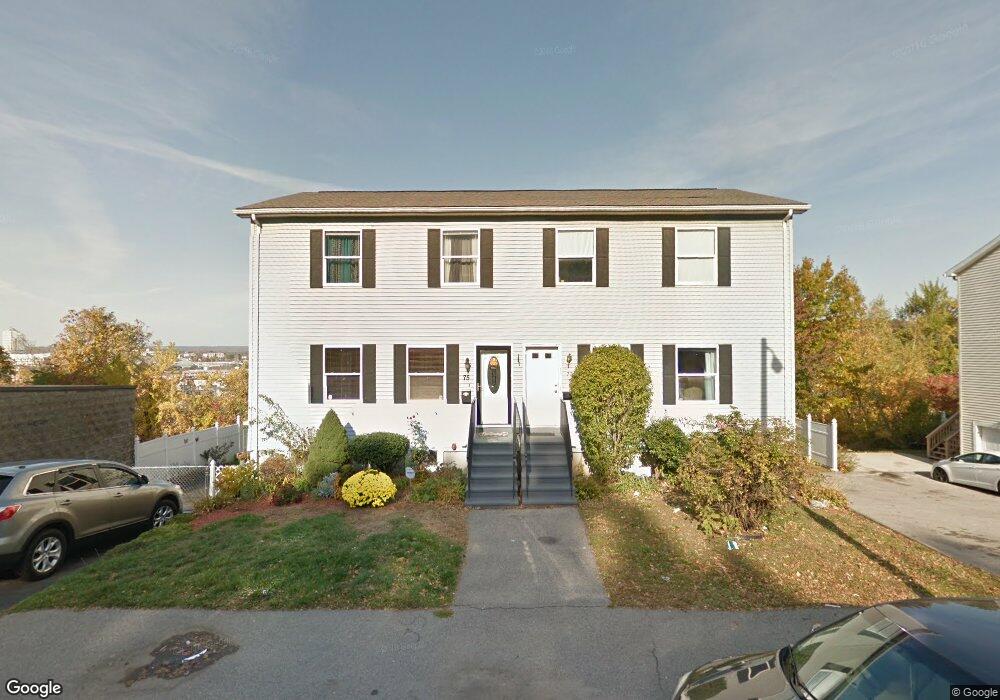
75 Norfolk St Unit 77 Worcester, MA 01604
Franklin Plantation NeighborhoodEstimated Value: $375,000 - $405,607
3
Beds
2
Baths
1,248
Sq Ft
$312/Sq Ft
Est. Value
About This Home
This home is located at 75 Norfolk St Unit 77, Worcester, MA 01604 and is currently estimated at $389,152, approximately $311 per square foot. 75 Norfolk St Unit 77 is a home located in Worcester County with nearby schools including Jacob Hiatt Magnet School, Chandler Magnet, and Grafton Street.
Ownership History
Date
Name
Owned For
Owner Type
Purchase Details
Closed on
Nov 7, 2007
Sold by
Ehrlich Paul
Bought by
Laureano-Rolon Joel and Estevez Samuel
Current Estimated Value
Home Financials for this Owner
Home Financials are based on the most recent Mortgage that was taken out on this home.
Original Mortgage
$166,800
Outstanding Balance
$106,025
Interest Rate
6.47%
Mortgage Type
Purchase Money Mortgage
Estimated Equity
$283,127
Purchase Details
Closed on
Jul 11, 2001
Sold by
Mr Real Est Inc
Bought by
Spokis John
Create a Home Valuation Report for This Property
The Home Valuation Report is an in-depth analysis detailing your home's value as well as a comparison with similar homes in the area
Home Values in the Area
Average Home Value in this Area
Purchase History
| Date | Buyer | Sale Price | Title Company |
|---|---|---|---|
| Laureano-Rolon Joel | $172,000 | -- | |
| Spokis John | $40,000 | -- |
Source: Public Records
Mortgage History
| Date | Status | Borrower | Loan Amount |
|---|---|---|---|
| Open | Laureano-Rolon Joel | $166,800 | |
| Previous Owner | Spokis John | $88,830 |
Source: Public Records
Tax History Compared to Growth
Tax History
| Year | Tax Paid | Tax Assessment Tax Assessment Total Assessment is a certain percentage of the fair market value that is determined by local assessors to be the total taxable value of land and additions on the property. | Land | Improvement |
|---|---|---|---|---|
| 2025 | $4,489 | $340,300 | $85,000 | $255,300 |
| 2024 | $4,257 | $309,600 | $85,000 | $224,600 |
| 2023 | $4,041 | $281,800 | $73,900 | $207,900 |
| 2022 | $3,669 | $241,200 | $59,200 | $182,000 |
| 2021 | $3,455 | $212,200 | $47,300 | $164,900 |
| 2020 | $3,397 | $199,800 | $47,000 | $152,800 |
| 2019 | $3,244 | $180,200 | $41,000 | $139,200 |
| 2018 | $3,247 | $171,700 | $41,000 | $130,700 |
| 2017 | $3,071 | $159,800 | $41,000 | $118,800 |
| 2016 | $3,011 | $146,100 | $29,900 | $116,200 |
| 2015 | $2,932 | $146,100 | $29,900 | $116,200 |
| 2014 | $2,855 | $146,100 | $29,900 | $116,200 |
Source: Public Records
Map
Nearby Homes