75 Rose St Massapequa Park, NY 11762
Estimated Value: $725,000 - $746,727
3
Beds
3
Baths
1,140
Sq Ft
$645/Sq Ft
Est. Value
About This Home
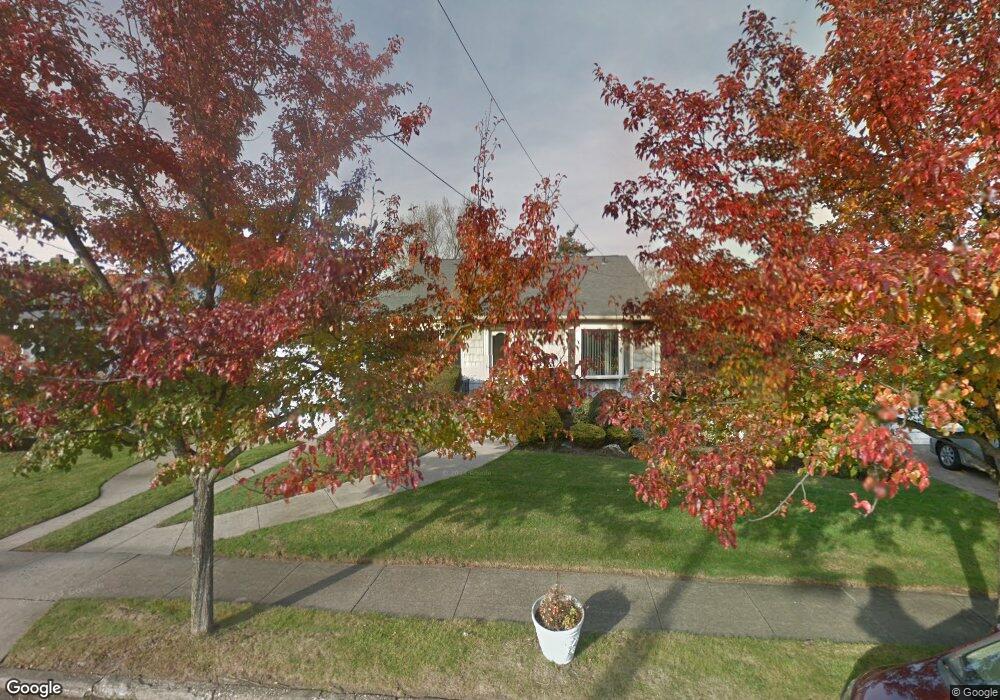
This home is located at 75 Rose St, Massapequa Park, NY 11762 and is currently estimated at $735,864, approximately $645 per square foot. 75 Rose St is a home located in Nassau County with nearby schools including Albany Avenue Elementary School, Weldon E. Howitt Middle School, and Farmingdale Senior High School.
Ownership History
Date
Name
Owned For
Owner Type
Purchase Details
Closed on
Jan 27, 2021
Sold by
Holzbaur Carolyn and Holzbaur Michael John
Bought by
Marino Thomas R
Current Estimated Value
Home Financials for this Owner
Home Financials are based on the most recent Mortgage that was taken out on this home.
Original Mortgage
$454,500
Outstanding Balance
$405,795
Interest Rate
2.6%
Mortgage Type
New Conventional
Estimated Equity
$330,069
Purchase Details
Closed on
Nov 27, 2001
Create a Home Valuation Report for This Property
The Home Valuation Report is an in-depth analysis detailing your home's value as well as a comparison with similar homes in the area
Home Values in the Area
Average Home Value in this Area
Purchase History
| Date | Buyer | Sale Price | Title Company |
|---|---|---|---|
| Marino Thomas R | $505,000 | Fidelity National Title | |
| -- | -- | -- |
Source: Public Records
Mortgage History
| Date | Status | Borrower | Loan Amount |
|---|---|---|---|
| Open | Marino Thomas R | $454,500 |
Source: Public Records
Tax History Compared to Growth
Tax History
| Year | Tax Paid | Tax Assessment Tax Assessment Total Assessment is a certain percentage of the fair market value that is determined by local assessors to be the total taxable value of land and additions on the property. | Land | Improvement |
|---|---|---|---|---|
| 2025 | $11,383 | $422 | $177 | $245 |
| 2024 | $2,648 | $404 | $169 | $235 |
| 2023 | $10,339 | $437 | $183 | $254 |
| 2022 | $10,339 | $437 | $183 | $254 |
| 2021 | $10,701 | $437 | $183 | $254 |
| 2020 | $4,047 | $478 | $477 | $1 |
| 2019 | $1,841 | $512 | $504 | $8 |
| 2018 | $2,855 | $546 | $0 | $0 |
| 2017 | $2,855 | $580 | $508 | $72 |
| 2016 | $4,832 | $614 | $484 | $130 |
| 2015 | $1,845 | $648 | $455 | $193 |
| 2014 | $1,845 | $648 | $455 | $193 |
| 2013 | $1,809 | $682 | $479 | $203 |
Source: Public Records
Map
Nearby Homes