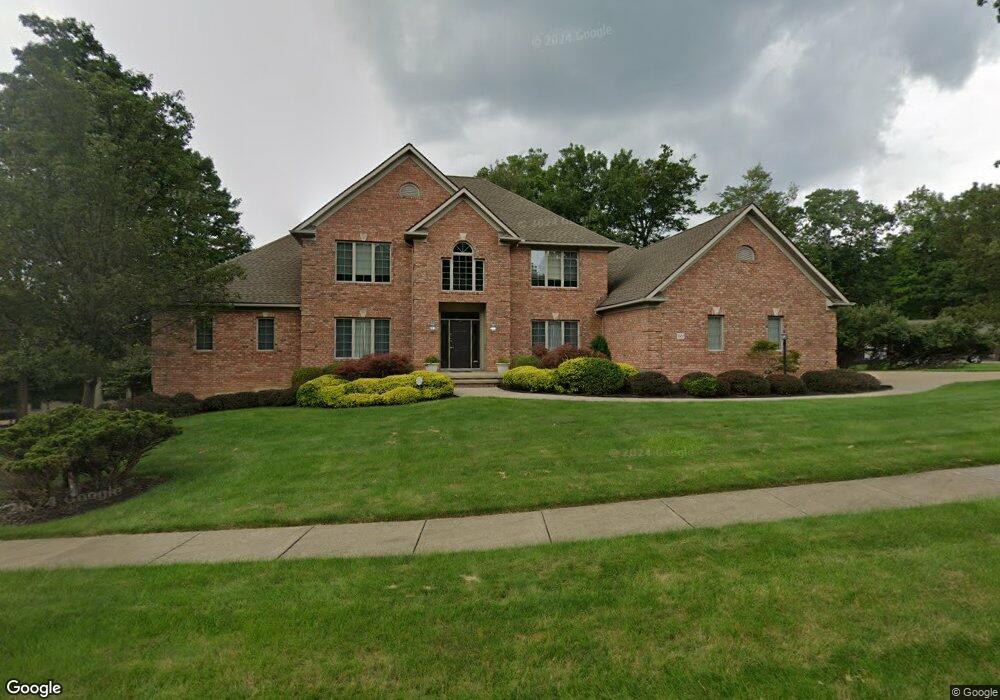
7500 Harley Hills Dr North Royalton, OH 44133
Estimated Value: $663,000 - $704,000
4
Beds
4
Baths
5,373
Sq Ft
$126/Sq Ft
Est. Value
About This Home
This home is located at 7500 Harley Hills Dr, North Royalton, OH 44133 and is currently estimated at $679,051, approximately $126 per square foot. 7500 Harley Hills Dr is a home located in Cuyahoga County with nearby schools including North Royalton Middle School, North Royalton High School, and Constellation Schools: Parma Community.
Ownership History
Date
Name
Owned For
Owner Type
Purchase Details
Closed on
Nov 7, 2016
Sold by
Sposit Carol A
Bought by
Sposit Carol A
Current Estimated Value
Purchase Details
Closed on
Oct 10, 2013
Sold by
Sposit Carol A
Bought by
Sposit Carol A
Purchase Details
Closed on
Nov 4, 2006
Sold by
Hall Gregory S and Buchanan Marikay S
Bought by
Sposit Donal J
Purchase Details
Closed on
Jan 19, 2001
Sold by
Carol A Sposit Trust and Sposit Donal
Bought by
Lasiychuk Yuriy and Lasiychuk Zoryana
Home Financials for this Owner
Home Financials are based on the most recent Mortgage that was taken out on this home.
Original Mortgage
$280,000
Interest Rate
6.89%
Mortgage Type
Credit Line Revolving
Purchase Details
Closed on
Oct 3, 1997
Sold by
Harley Hills Dev Corp
Bought by
Hall Gregory S and Buchanan Marikay S
Purchase Details
Closed on
Jan 1, 1993
Bought by
Harley Hills Dev Corp
Create a Home Valuation Report for This Property
The Home Valuation Report is an in-depth analysis detailing your home's value as well as a comparison with similar homes in the area
Home Values in the Area
Average Home Value in this Area
Purchase History
| Date | Buyer | Sale Price | Title Company |
|---|---|---|---|
| Sposit Carol A | -- | None Available | |
| Sposit Carol A | -- | Attorney | |
| Sposit Donal J | $405,000 | Approved Statewide | |
| Lasiychuk Yuriy | $635,000 | Infinity Title | |
| Hall Gregory S | $62,000 | -- | |
| Harley Hills Dev Corp | -- | -- |
Source: Public Records
Mortgage History
| Date | Status | Borrower | Loan Amount |
|---|---|---|---|
| Previous Owner | Lasiychuk Yuriy | $280,000 |
Source: Public Records
Tax History Compared to Growth
Tax History
| Year | Tax Paid | Tax Assessment Tax Assessment Total Assessment is a certain percentage of the fair market value that is determined by local assessors to be the total taxable value of land and additions on the property. | Land | Improvement |
|---|---|---|---|---|
| 2024 | $10,563 | $191,660 | $39,200 | $152,460 |
| 2023 | $8,692 | $146,410 | $36,230 | $110,180 |
| 2022 | $8,660 | $146,405 | $36,225 | $110,180 |
| 2021 | $8,750 | $146,410 | $36,230 | $110,180 |
| 2020 | $8,741 | $139,440 | $34,510 | $104,930 |
| 2019 | $8,486 | $398,400 | $98,600 | $299,800 |
| 2018 | $7,966 | $139,440 | $34,510 | $104,930 |
| 2017 | $7,852 | $123,030 | $31,640 | $91,390 |
| 2016 | $7,358 | $123,030 | $31,640 | $91,390 |
| 2015 | $7,357 | $123,030 | $31,640 | $91,390 |
| 2014 | $6,689 | $111,830 | $28,770 | $83,060 |
Source: Public Records
Map
Nearby Homes
- 12701 Gordon St
- 7554 Margaret Dr
- 7595 Margaret Dr
- 7545 Margaret Dr
- 7585 Margaret Dr
- 7575 Margaret Dr
- 7535 Margaret Dr
- 7555 Margaret Dr
- 7600 Margaret Dr
- 7564 Margaret Dr
- 7574 Margaret Dr
- S/L Margaret Dr
- 12906 Cartwright Pkwy
- 13000 Cartwright Pkwy
- 9035 Wallings Rd
- 13831 Woodcroft Trace
- 8381 N Akins Rd Unit H7
- 11550 York Rd
- 9611 Sunrise Blvd Unit K2
- 9530 Cove Dr Unit C-25
- 7529 Julia Dr
- 7487 Julia Dr
- 12711 Gordon St
- s/l 2 Margaret Dr
- 12691 Gordon St
- 0 Margaret Dr
- 7499 Harley Hills Dr
- s/l 4 Margaret Dr
- S/L 0 Margaret Dr
- s/l 3 Margaret Dr
- 7511 Harley Hills Dr
- s/l 5 Margaret Dr
- 7475 Julia Dr
- 12681 Gordon St
- 7535 Harley Hills Dr
- s/l 13 Margaret Dr
- s/l 12 Margaret Dr
- s/l 11 Margaret Dr
- s/l 10 Margaret Dr
- s/l 8 Margaret Dr