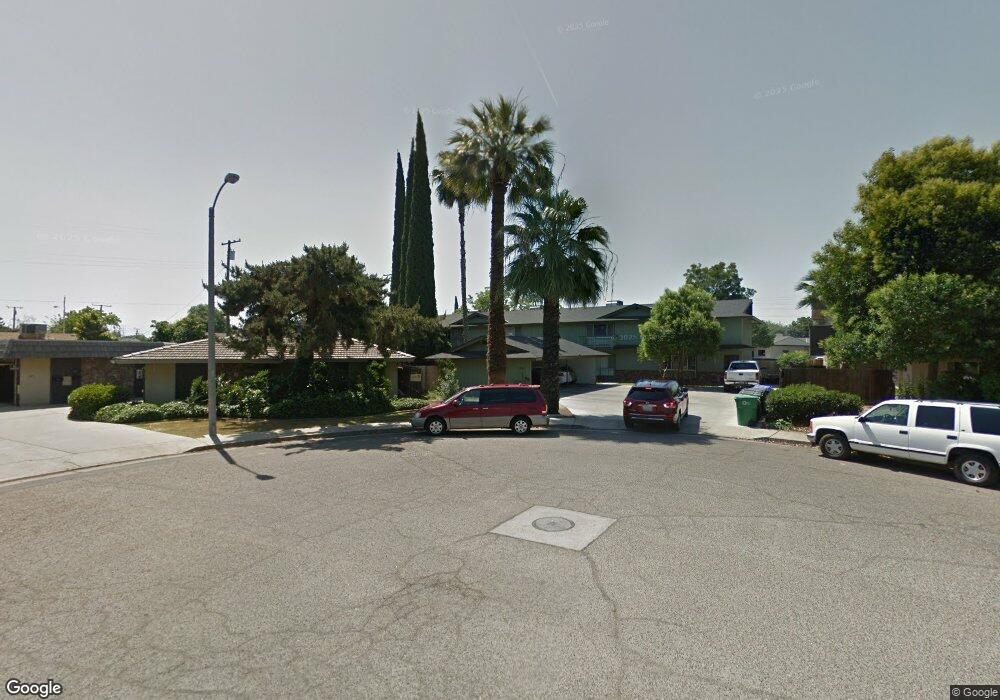
751 Theta Cir Porterville, CA 93257
Porterville Northwest NeighborhoodEstimated Value: $460,000 - $679,000
8
Beds
8
Baths
5,300
Sq Ft
$105/Sq Ft
Est. Value
About This Home
This home is located at 751 Theta Cir, Porterville, CA 93257 and is currently estimated at $558,333, approximately $105 per square foot. 751 Theta Cir is a home located in Tulare County with nearby schools including Monte Vista Elementary School, Strathmore Elementary School, and Sequoia Middle School.
Ownership History
Date
Name
Owned For
Owner Type
Purchase Details
Closed on
Feb 13, 2019
Sold by
Kasab Hosam
Bought by
Kasab Hosam and Hosam Kasab Separate Property
Current Estimated Value
Purchase Details
Closed on
Nov 6, 2017
Sold by
Dakhil Mounib
Bought by
Dakhil Commercial Properties Lp
Purchase Details
Closed on
Jan 9, 2014
Sold by
Kasab Hosam M
Bought by
Kasab Hosam M and Dakhil Mounib
Home Financials for this Owner
Home Financials are based on the most recent Mortgage that was taken out on this home.
Original Mortgage
$154,965
Interest Rate
4.46%
Mortgage Type
Purchase Money Mortgage
Purchase Details
Closed on
Dec 4, 2012
Sold by
Scrimger James R
Bought by
Kasab Hosam M and Dakhil Mounib
Purchase Details
Closed on
Dec 22, 1993
Sold by
Scrimger James R
Bought by
Scrimger James R
Home Financials for this Owner
Home Financials are based on the most recent Mortgage that was taken out on this home.
Original Mortgage
$161,000
Interest Rate
7.1%
Create a Home Valuation Report for This Property
The Home Valuation Report is an in-depth analysis detailing your home's value as well as a comparison with similar homes in the area
Home Values in the Area
Average Home Value in this Area
Purchase History
| Date | Buyer | Sale Price | Title Company |
|---|---|---|---|
| Kasab Hosam | -- | None Available | |
| Dakhil Commercial Properties Lp | -- | None Available | |
| Dakhil Management Llc | -- | None Available | |
| Dakhil Mounib | -- | None Available | |
| Kasab Hosam M | -- | Chicago Title Co | |
| Kasab Hosam M | $154,000 | None Available | |
| Scrimger James R | -- | Chicago Title Company |
Source: Public Records
Mortgage History
| Date | Status | Borrower | Loan Amount |
|---|---|---|---|
| Previous Owner | Kasab Hosam M | $154,965 | |
| Previous Owner | Scrimger James R | $161,000 |
Source: Public Records
Tax History Compared to Growth
Tax History
| Year | Tax Paid | Tax Assessment Tax Assessment Total Assessment is a certain percentage of the fair market value that is determined by local assessors to be the total taxable value of land and additions on the property. | Land | Improvement |
|---|---|---|---|---|
| 2025 | $2,014 | $189,636 | $49,255 | $140,381 |
| 2024 | $2,014 | $185,919 | $48,290 | $137,629 |
| 2023 | $2,012 | $182,275 | $47,344 | $134,931 |
| 2022 | $1,950 | $178,702 | $46,416 | $132,286 |
| 2021 | $1,927 | $175,198 | $45,506 | $129,692 |
| 2020 | $1,907 | $173,401 | $45,039 | $128,362 |
| 2019 | $1,873 | $170,001 | $44,156 | $125,845 |
| 2018 | $1,839 | $166,667 | $43,290 | $123,377 |
| 2017 | $1,794 | $163,399 | $42,441 | $120,958 |
| 2016 | $1,722 | $160,195 | $41,609 | $118,586 |
| 2015 | $5,933 | $157,789 | $40,984 | $116,805 |
| 2014 | $5,933 | $331,561 | $51,241 | $280,320 |
Source: Public Records
Map
Nearby Homes
- 701 W Theta Ave
- 701 Theta Ave
- 927 Shadowood Place
- 681 W Mulberry Ave
- 680 W Gerry Cir
- 816 W Grand Ave
- 824 W Grand Ave
- 572 Memory Ln
- 670 W Kanai Ave
- 579 N Villa St
- 479 W Grand Ave
- 1167 N Main St
- 643 W Belleview Ave
- 793 Pioneer Ave
- 700 N Prospect St
- 829 Pioneer Ave
- 640 N Prospect St
- 1060 W Belleview Ave
- 590 W Morton Ave
- 1045 N Westside St
- 741 Theta Cir Unit 12
- 741 Theta Cir
- 761 Theta Ave
- 861 N Cottage St
- 871 N Cottage St
- 851 N Cottage St
- 771 Theta Cir
- 742 Theta Cir
- 742 Theta Cir Unit 742 Theta Circle uni
- 742 Theta Cir
- 841 N Cottage St
- 750 Theta Cir
- 760 Theta Cir
- 734 Theta Ave
- 770 Theta Cir
- 729 Mccomb Ave
- 729 Mccomb Ave
- 862 N Cottage St
- 852 N Cottage St
- 724 W Theta Ave