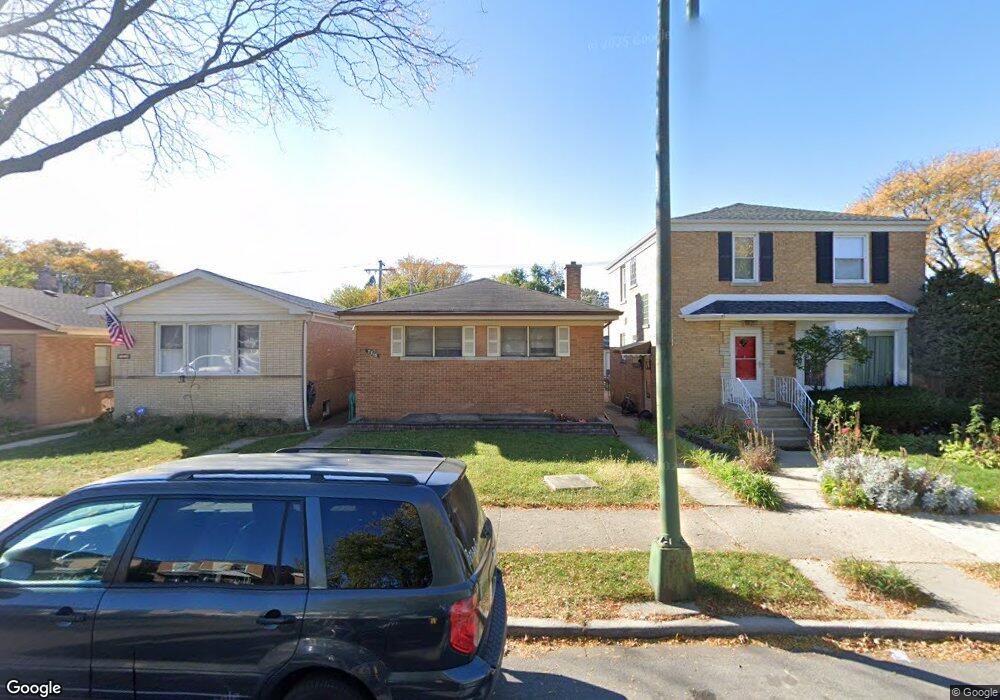
7516 N California Ave Chicago, IL 60645
West Ridge NeighborhoodEstimated Value: $436,000 - $500,000
2
Beds
1
Bath
1,296
Sq Ft
$368/Sq Ft
Est. Value
About This Home
This home is located at 7516 N California Ave, Chicago, IL 60645 and is currently estimated at $476,926, approximately $367 per square foot. 7516 N California Ave is a home located in Cook County with nearby schools including Rogers Elementary School, Mather High School, and Acero - Sor Juana Ines de la Cruz School.
Ownership History
Date
Name
Owned For
Owner Type
Purchase Details
Closed on
Aug 12, 2012
Sold by
Iqbal Ameena
Bought by
Active Property Holdings Inc
Current Estimated Value
Purchase Details
Closed on
Apr 30, 2010
Sold by
Zaidi Ahmed
Bought by
Iqbal Ameena
Purchase Details
Closed on
Jul 10, 2006
Sold by
Noor Noorjahan Qasim
Bought by
Zaidi Ahmed
Home Financials for this Owner
Home Financials are based on the most recent Mortgage that was taken out on this home.
Original Mortgage
$363,850
Interest Rate
8.75%
Mortgage Type
Unknown
Purchase Details
Closed on
Aug 18, 1994
Sold by
Ross Herbert and Ross Ella
Bought by
Noor Mohammed Qasim and Noor Noorjehan Qasim
Home Financials for this Owner
Home Financials are based on the most recent Mortgage that was taken out on this home.
Original Mortgage
$113,450
Interest Rate
8.72%
Create a Home Valuation Report for This Property
The Home Valuation Report is an in-depth analysis detailing your home's value as well as a comparison with similar homes in the area
Home Values in the Area
Average Home Value in this Area
Purchase History
| Date | Buyer | Sale Price | Title Company |
|---|---|---|---|
| Active Property Holdings Inc | -- | None Available | |
| Iqbal Ameena | $225,000 | None Available | |
| Zaidi Ahmed | $383,000 | First American Title | |
| Noor Mohammed Qasim | $133,500 | -- |
Source: Public Records
Mortgage History
| Date | Status | Borrower | Loan Amount |
|---|---|---|---|
| Previous Owner | Zaidi Ahmed | $363,850 | |
| Previous Owner | Noor Mohammed Qasim | $113,450 |
Source: Public Records
Tax History Compared to Growth
Tax History
| Year | Tax Paid | Tax Assessment Tax Assessment Total Assessment is a certain percentage of the fair market value that is determined by local assessors to be the total taxable value of land and additions on the property. | Land | Improvement |
|---|---|---|---|---|
| 2024 | $6,359 | $34,000 | $9,375 | $24,625 |
| 2023 | $6,788 | $33,000 | $7,500 | $25,500 |
| 2022 | $6,788 | $33,000 | $7,500 | $25,500 |
| 2021 | $6,636 | $33,000 | $7,500 | $25,500 |
| 2020 | $4,991 | $22,402 | $5,437 | $16,965 |
| 2019 | $4,995 | $24,864 | $5,437 | $19,427 |
| 2018 | $4,912 | $24,864 | $5,437 | $19,427 |
| 2017 | $5,564 | $25,845 | $4,875 | $20,970 |
| 2016 | $5,176 | $25,845 | $4,875 | $20,970 |
| 2015 | $4,736 | $25,845 | $4,875 | $20,970 |
| 2014 | $4,181 | $22,536 | $4,500 | $18,036 |
| 2013 | $4,099 | $22,536 | $4,500 | $18,036 |
Source: Public Records
Map
Nearby Homes
- 7433 N Washtenaw Ave
- 2011 Brummel St
- 215 Brown Ave
- 1615 W Howard St Unit 303
- 3024 W Fargo Ave
- 220 Richmond St
- 235 Richmond St
- 2522 W Jarvis Ave
- 309 Darrow Ave
- 2650 W Touhy Ave
- 1406 Brummel St
- 3123 W Chase Ave
- 401 Dewey Ave
- 347 Florence Ave
- 419 Florence Ave
- 1810 South Blvd
- 7546 N Oakley Ave
- 7141 N Kedzie Ave Unit 406
- 7141 N Kedzie Ave Unit 1515
- 7141 N Kedzie Ave Unit 1209
- 7514 N California Ave
- 7520 N California Ave
- 7512 N California Ave
- 2801 W Jerome St
- 7508 N California Ave
- 2815 W Jerome St
- 7504 N California Ave
- 2814 W Birchwood Ave
- 2800 W Birchwood Ave
- 2821 W Jerome St
- 2818 W Birchwood Ave
- 7515 N California Ave
- 7901 S California Ave
- 2825 W Jerome St
- 7517 N California Ave
- 7511 N California Ave
- 2820 W Birchwood Ave
- 7509 N California Ave
- 2757 W Jerome St
- 7505 N California Ave