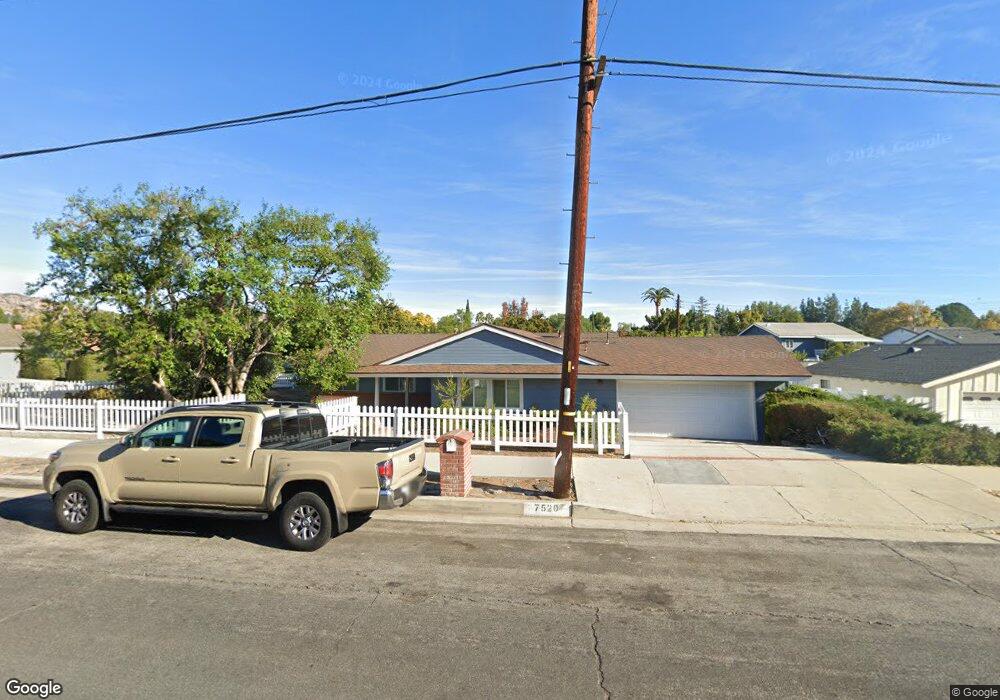
7520 March Ave Canoga Park, CA 91304
Canoga Park NeighborhoodEstimated Value: $1,140,466 - $1,471,000
5
Beds
3
Baths
2,352
Sq Ft
$558/Sq Ft
Est. Value
About This Home
This home is located at 7520 March Ave, Canoga Park, CA 91304 and is currently estimated at $1,312,617, approximately $558 per square foot. 7520 March Ave is a home located in Los Angeles County with nearby schools including Pomelo Community Charter, Justice Street Academy Charter, and Enadia Way Technology Charter.
Ownership History
Date
Name
Owned For
Owner Type
Purchase Details
Closed on
Apr 19, 2016
Sold by
Charney George A and The Ann I Charney Administrati
Bought by
Charney George A and The George A Charney Dynasty T
Current Estimated Value
Purchase Details
Closed on
Jan 26, 2016
Sold by
Charney George A and The Ann I Charney Survivors Tr
Bought by
Charney George A and The Ann I Charney Administrati
Purchase Details
Closed on
Apr 27, 2011
Sold by
Charney Ann I and Charney George A
Bought by
Charney Ann I and Charney George A
Purchase Details
Closed on
Jul 23, 2009
Sold by
Charney Ann I and Charney George A
Bought by
Charney Ann I and Charney George A
Purchase Details
Closed on
Jan 31, 2005
Sold by
Charney George L and Charney Ann
Bought by
Charney George L and Charney Ann I
Purchase Details
Closed on
Dec 26, 1998
Sold by
Charney George L and Charney Ann
Bought by
Charney George A and Charney Aminta
Purchase Details
Closed on
Sep 10, 1995
Sold by
Charney George Leslie and Charney Ann
Bought by
Charney George L and Charney Ann I
Home Financials for this Owner
Home Financials are based on the most recent Mortgage that was taken out on this home.
Original Mortgage
$28,583
Interest Rate
8.3%
Mortgage Type
Seller Take Back
Create a Home Valuation Report for This Property
The Home Valuation Report is an in-depth analysis detailing your home's value as well as a comparison with similar homes in the area
Home Values in the Area
Average Home Value in this Area
Purchase History
| Date | Buyer | Sale Price | Title Company |
|---|---|---|---|
| Charney George A | -- | None Available | |
| Charney George A | -- | None Available | |
| Charney Ann I | -- | None Available | |
| Charney Ann I | -- | None Available | |
| Charney George L | -- | -- | |
| Charney George A | -- | -- | |
| Charney George L | $3,000 | -- |
Source: Public Records
Mortgage History
| Date | Status | Borrower | Loan Amount |
|---|---|---|---|
| Previous Owner | Charney George L | $28,583 |
Source: Public Records
Tax History Compared to Growth
Tax History
| Year | Tax Paid | Tax Assessment Tax Assessment Total Assessment is a certain percentage of the fair market value that is determined by local assessors to be the total taxable value of land and additions on the property. | Land | Improvement |
|---|---|---|---|---|
| 2025 | $6,437 | $511,329 | $198,333 | $312,996 |
| 2024 | $6,437 | $501,304 | $194,445 | $306,859 |
| 2023 | $6,318 | $491,476 | $190,633 | $300,843 |
| 2022 | $6,035 | $481,841 | $186,896 | $294,945 |
| 2021 | $5,952 | $472,394 | $183,232 | $289,162 |
| 2019 | $5,779 | $458,385 | $177,799 | $280,586 |
| 2018 | $5,655 | $449,398 | $174,313 | $275,085 |
| 2016 | $5,389 | $431,950 | $167,546 | $264,404 |
| 2015 | $5,313 | $425,463 | $165,030 | $260,433 |
| 2014 | $5,337 | $417,130 | $161,798 | $255,332 |
Source: Public Records
Map
Nearby Homes
- 7556 Chaminade Ave
- 23708 Sandalwood St
- 23234 Valerio St
- 7422 Kyle Ct
- 23716 Elkwood St
- 7417 Darnoch Way
- 7442 Bobbyboyar Ave
- 7432 Dorie Dr
- 7446 Woodlake Ave
- 7282 Woodvale Ct
- 7474 Darnoch Way
- 7254 Pomelo Dr
- 23760 Harwich Place
- 7034 Middlesbury Ridge Cir
- 7729 Sedan Ave
- 24005 Clarington Dr
- 23025 Covello St
- 7024 Middlesbury Ridge Cir
- 7152 Pomelo Dr
- 23676 Justice St
- 7510 March Ave
- 23404 Windom St
- 23415 Windom St
- 23500 Windom St
- 7500 March Ave
- 23419 Windom St
- 23411 Windom St
- 7517 March Ave
- 23400 Windom St
- 23407 Windom St
- 23501 Windom St
- 7509 March Ave
- 23510 Windom St
- 24015 Woolsey
- 23420 Covello St
- 7501 March Ave
- 7540 March Ave
- 23416 Covello St
- 23403 Windom St
- 23509 Windom St