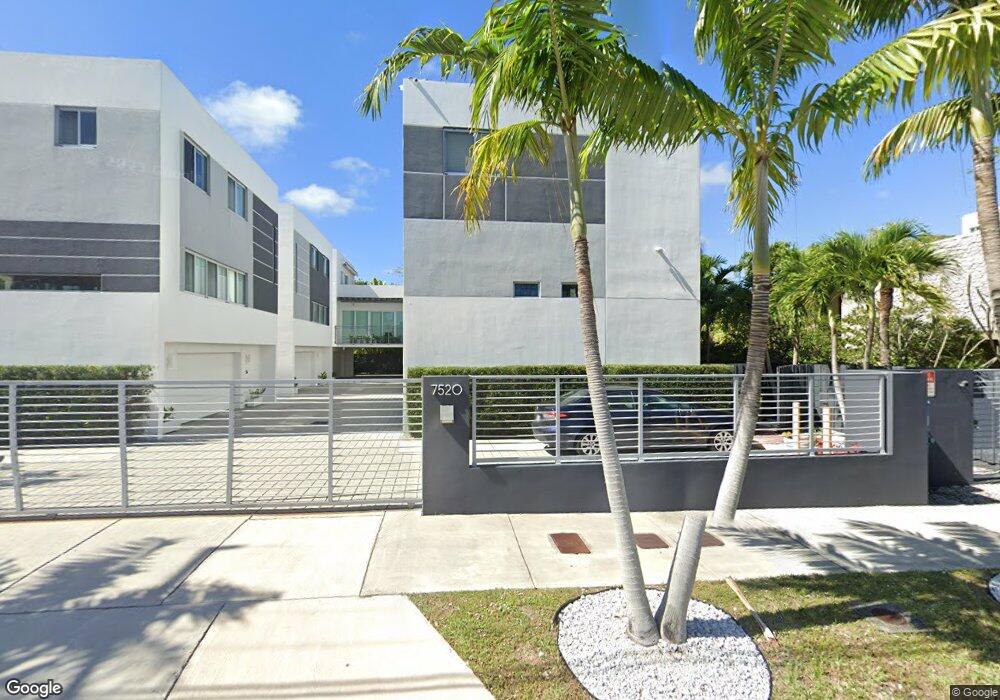
7520 SW 59th Place Unit E South Miami, FL 33143
Estimated Value: $675,000 - $1,381,000
3
Beds
2
Baths
1,586
Sq Ft
$633/Sq Ft
Est. Value
About This Home
This home is located at 7520 SW 59th Place Unit E, South Miami, FL 33143 and is currently estimated at $1,003,595, approximately $632 per square foot. 7520 SW 59th Place Unit E is a home located in Miami-Dade County with nearby schools including Ludlam Elementary School, South Miami Middle School, and South Miami Senior High School.
Ownership History
Date
Name
Owned For
Owner Type
Purchase Details
Closed on
Dec 29, 2022
Sold by
Gurkin Louis
Bought by
Gurkin Llc
Current Estimated Value
Purchase Details
Closed on
Jul 28, 2008
Sold by
Orlando Land Management & Development Gr
Bought by
Gurkin Louis and Gurkin Shari
Purchase Details
Closed on
Aug 31, 2001
Sold by
Donald W Pelton M and Margaret M Pelton M
Bought by
Superior Dev Iv
Purchase Details
Closed on
Jan 30, 1998
Sold by
Millertr William A and Peltontr Margaret M
Bought by
Miller William A and Pelton Margaret M
Purchase Details
Closed on
Aug 29, 1996
Sold by
Margolin Helen M
Bought by
Pelton Margaret M and Easley Katherine E
Purchase Details
Closed on
Aug 15, 1996
Sold by
Helen M Margolin Tr
Bought by
Margolin Helen M
Purchase Details
Closed on
Feb 27, 1995
Sold by
Margolin Helen M and Margolin Helen Miller
Bought by
Margolin Helen M
Create a Home Valuation Report for This Property
The Home Valuation Report is an in-depth analysis detailing your home's value as well as a comparison with similar homes in the area
Home Values in the Area
Average Home Value in this Area
Purchase History
| Date | Buyer | Sale Price | Title Company |
|---|---|---|---|
| Gurkin Llc | $270,400 | -- | |
| Gurkin Louis | $355,000 | Attorney | |
| Superior Dev Iv | $93,400 | -- | |
| Superior Dev Iv | $93,400 | -- | |
| Superior Dev Iv | $93,400 | -- | |
| Miller William A | $100 | -- | |
| Pelton Margaret M | $100 | -- | |
| Margolin Helen M | $100 | -- | |
| Margolin Helen M | -- | -- |
Source: Public Records
Tax History Compared to Growth
Tax History
| Year | Tax Paid | Tax Assessment Tax Assessment Total Assessment is a certain percentage of the fair market value that is determined by local assessors to be the total taxable value of land and additions on the property. | Land | Improvement |
|---|---|---|---|---|
| 2025 | $12,888 | $675,938 | -- | -- |
| 2024 | $12,959 | $675,938 | -- | -- |
| 2023 | $12,959 | $675,938 | $0 | $0 |
| 2022 | $10,399 | $540,750 | $0 | $0 |
| 2021 | $10,340 | $515,000 | $0 | $0 |
| 2020 | $10,074 | $515,000 | $0 | $0 |
| 2019 | $9,519 | $515,000 | $0 | $0 |
| 2018 | $8,769 | $515,000 | $0 | $0 |
| 2017 | $7,439 | $369,857 | $0 | $0 |
| 2016 | $7,149 | $336,234 | $0 | $0 |
| 2015 | $6,623 | $305,668 | $0 | $0 |
| 2014 | $5,860 | $277,880 | $0 | $0 |
Source: Public Records
Map
Nearby Homes
- 5909 SW 76th St
- 6021 SW 76th St
- 7621 SW 59th Ct
- 6023 SW 76th St
- 5864 SW 74th Terrace Unit G
- 5839 SW 74th Terrace Unit 305
- 5776 SW 77th Terrace
- 5975 SW 80th St
- 6003 SW 80th St
- 6250 SW 78th St
- 6001 SW 70th St Unit 429
- 6001 SW 70th St Unit 139
- 6001 SW 70th St Unit 542
- 6001 SW 70th St Unit 535
- 6001 SW 70th St Unit 127
- 6001 SW 70th St Unit 650
- 6001 SW 70th St Unit 133
- 6001 SW 70th St Unit 304
- 6001 SW 70th St Unit 231
- 6001 SW 70th St Unit 113
- 7520 SW 59th Place Unit 1
- 7520 SW 59th Place Unit 5
- 7520 SW 59th Place Unit STUDIO
- 7520 SW 59th Place
- 7520 SW 59th Place
- 7520 SW 59th Place Unit C
- 7520 SW 59th Place Unit B
- 7520 SW 59th Place Unit D
- 7520 SW 59th Place Unit A
- 7520 SW 59th Place Unit 2
- 7500 SW 59 Place (April) 2nd Floor
- 7511 SW 59th Place
- 7500 SW 59th Place Unit 214
- 7500 SW 59th Place Unit (Oct)
- 5991 SW 76th St Unit C4
- 5991 SW 76th St Unit B5
- 7441 SW 59th Place Unit 6
- 7441 SW 59th Place Unit 12A
- 7441 SW 59th Place Unit 12B
- 7441 SW 59th Place Unit 8