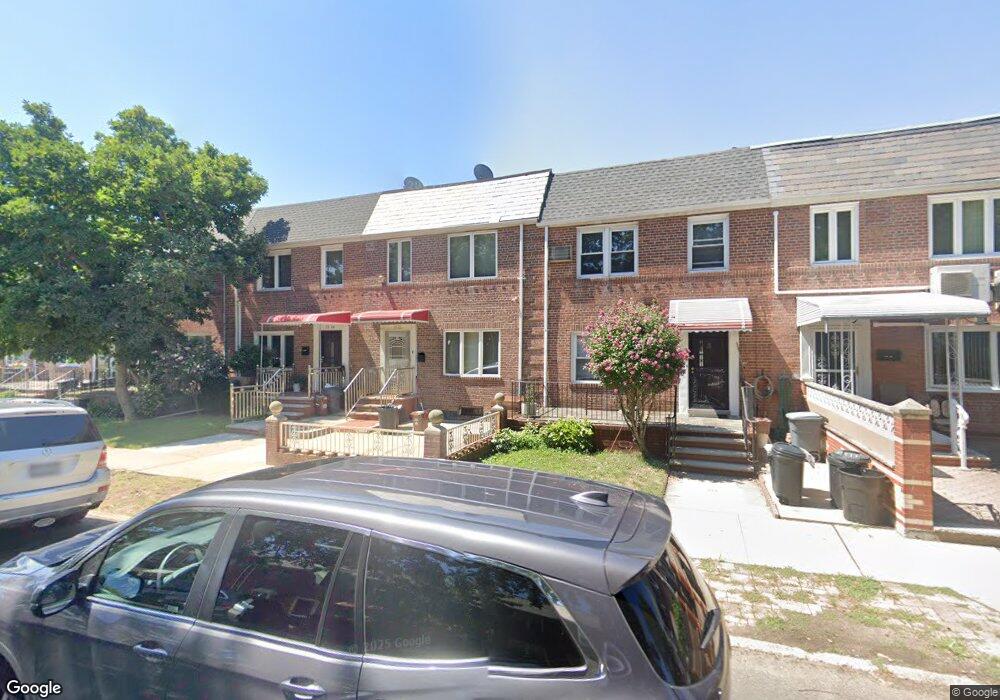
7522 169th St Fresh Meadows, NY 11366
Hillcrest NeighborhoodEstimated Value: $929,159 - $1,096,000
--
Bed
--
Bath
1,360
Sq Ft
$737/Sq Ft
Est. Value
About This Home
This home is located at 7522 169th St, Fresh Meadows, NY 11366 and is currently estimated at $1,002,790, approximately $737 per square foot. 7522 169th St is a home located in Queens County with nearby schools including P.S. 173 - Fresh Meadow and George J. Ryan Middle School 216.
Ownership History
Date
Name
Owned For
Owner Type
Purchase Details
Closed on
Sep 30, 2015
Sold by
Lam See Lin and Lau Sze Mei
Bought by
Lau Sze Mei
Current Estimated Value
Purchase Details
Closed on
Aug 13, 2004
Sold by
Chung Sui San and Lau See Ling
Bought by
Lam See Lin and Lau Sze Mei
Home Financials for this Owner
Home Financials are based on the most recent Mortgage that was taken out on this home.
Original Mortgage
$178,000
Interest Rate
6.02%
Mortgage Type
Purchase Money Mortgage
Create a Home Valuation Report for This Property
The Home Valuation Report is an in-depth analysis detailing your home's value as well as a comparison with similar homes in the area
Home Values in the Area
Average Home Value in this Area
Purchase History
| Date | Buyer | Sale Price | Title Company |
|---|---|---|---|
| Lau Sze Mei | -- | -- | |
| Lam See Lin | $255,000 | -- |
Source: Public Records
Mortgage History
| Date | Status | Borrower | Loan Amount |
|---|---|---|---|
| Previous Owner | Lam See Lin | $178,000 |
Source: Public Records
Tax History Compared to Growth
Tax History
| Year | Tax Paid | Tax Assessment Tax Assessment Total Assessment is a certain percentage of the fair market value that is determined by local assessors to be the total taxable value of land and additions on the property. | Land | Improvement |
|---|---|---|---|---|
| 2025 | $7,840 | $41,374 | $10,475 | $30,899 |
| 2024 | $7,840 | $39,035 | $9,283 | $29,752 |
| 2023 | $7,397 | $36,826 | $8,706 | $28,120 |
| 2022 | $7,352 | $52,980 | $14,340 | $38,640 |
| 2021 | $7,691 | $49,620 | $14,340 | $35,280 |
| 2020 | $7,298 | $48,120 | $14,340 | $33,780 |
| 2019 | $6,805 | $47,700 | $14,340 | $33,360 |
| 2018 | $6,256 | $30,688 | $9,379 | $21,309 |
| 2017 | $6,256 | $30,688 | $10,418 | $20,270 |
| 2016 | $6,088 | $30,688 | $10,418 | $20,270 |
| 2015 | $3,492 | $28,732 | $13,452 | $15,280 |
| 2014 | $3,492 | $27,108 | $14,396 | $12,712 |
Source: Public Records
Map
Nearby Homes