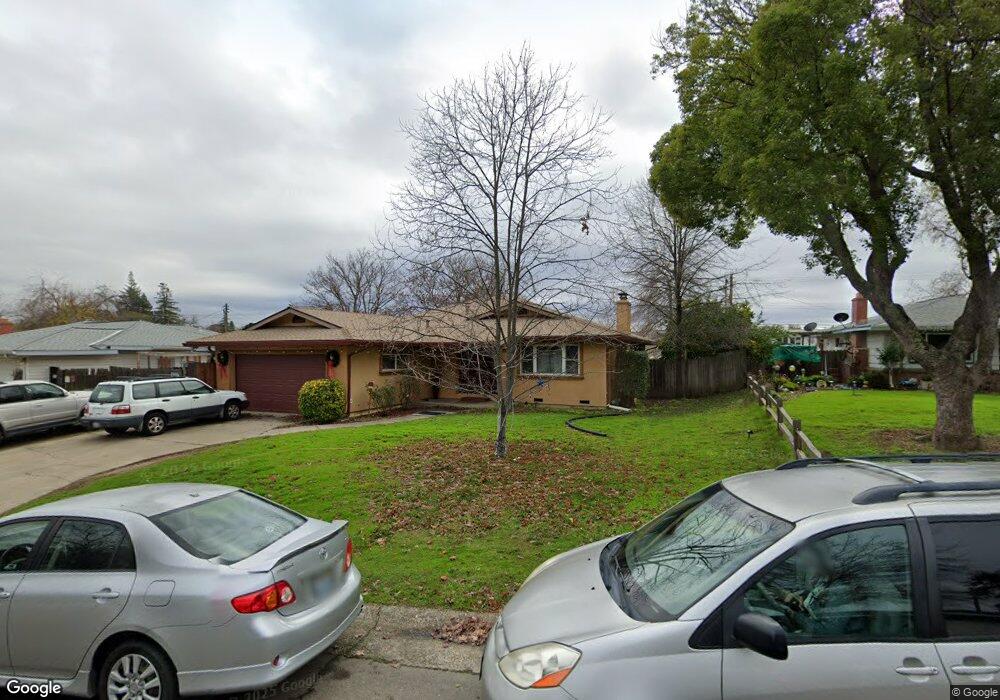
7536 Eastgate Ave Citrus Heights, CA 95610
Estimated Value: $445,000 - $538,300
4
Beds
2
Baths
1,784
Sq Ft
$283/Sq Ft
Est. Value
About This Home
This home is located at 7536 Eastgate Ave, Citrus Heights, CA 95610 and is currently estimated at $504,325, approximately $282 per square foot. 7536 Eastgate Ave is a home located in Sacramento County with nearby schools including Skycrest Elementary School, Will Rogers Middle School, and San Juan High School.
Ownership History
Date
Name
Owned For
Owner Type
Purchase Details
Closed on
Oct 29, 2001
Sold by
Sanabria Denise L
Bought by
Sanabria Clemente T and Sanabria Denise Lee
Current Estimated Value
Home Financials for this Owner
Home Financials are based on the most recent Mortgage that was taken out on this home.
Original Mortgage
$140,000
Outstanding Balance
$55,203
Interest Rate
6.84%
Estimated Equity
$449,122
Purchase Details
Closed on
Jun 19, 2000
Sold by
Velasquez Denise L
Bought by
Sanabria Denise L
Home Financials for this Owner
Home Financials are based on the most recent Mortgage that was taken out on this home.
Original Mortgage
$141,300
Interest Rate
8.53%
Purchase Details
Closed on
Jun 6, 2000
Sold by
Ploughman Robert E and Ploughman Kimberly M
Bought by
Velasquez Denise L
Home Financials for this Owner
Home Financials are based on the most recent Mortgage that was taken out on this home.
Original Mortgage
$141,300
Interest Rate
8.53%
Create a Home Valuation Report for This Property
The Home Valuation Report is an in-depth analysis detailing your home's value as well as a comparison with similar homes in the area
Home Values in the Area
Average Home Value in this Area
Purchase History
| Date | Buyer | Sale Price | Title Company |
|---|---|---|---|
| Sanabria Clemente T | -- | Stewart Title | |
| Sanabria Denise L | -- | Stewart Title | |
| Velasquez Denise L | -- | Stewart Title | |
| Velasquez Denise L | $157,000 | Stewart Title | |
| Ploughman Robert E | -- | Stewart Title |
Source: Public Records
Mortgage History
| Date | Status | Borrower | Loan Amount |
|---|---|---|---|
| Open | Sanabria Clemente T | $140,000 | |
| Previous Owner | Ploughman Robert E | $141,300 |
Source: Public Records
Tax History Compared to Growth
Tax History
| Year | Tax Paid | Tax Assessment Tax Assessment Total Assessment is a certain percentage of the fair market value that is determined by local assessors to be the total taxable value of land and additions on the property. | Land | Improvement |
|---|---|---|---|---|
| 2025 | $2,768 | $241,278 | $61,465 | $179,813 |
| 2024 | $2,768 | $236,548 | $60,260 | $176,288 |
| 2023 | $2,696 | $231,911 | $59,079 | $172,832 |
| 2022 | $2,680 | $227,365 | $57,921 | $169,444 |
| 2021 | $2,634 | $222,908 | $56,786 | $166,122 |
| 2020 | $2,584 | $220,623 | $56,204 | $164,419 |
| 2019 | $2,531 | $216,298 | $55,102 | $161,196 |
| 2018 | $2,500 | $212,058 | $54,022 | $158,036 |
| 2017 | $2,474 | $207,901 | $52,963 | $154,938 |
| 2016 | $2,309 | $203,825 | $51,925 | $151,900 |
| 2015 | $2,269 | $200,765 | $51,146 | $149,619 |
| 2014 | $2,220 | $196,834 | $50,145 | $146,689 |
Source: Public Records
Map
Nearby Homes
- 5718 Southgrove Dr
- 5617 Mariposa Ave
- 7449 Willowcreek Dr
- 7746 Eastgate Ave
- 7738 Eastgate Ave
- 5424 Mariposa Ave
- 5664 San Juan Ave
- 5645 San Juan Ave
- 5513 San Juan Ave
- 7632 Capricorn Dr
- 5810 Primrose Dr
- 5829 San Juan Ave Unit 5
- 5829 San Juan Ave Unit 39
- 6108 Rita Lou Way
- 7711 Juan Way Unit 22B
- 6035 Cheshire Way
- 5829 Sperry Dr
- 33 Coyle Creek Cir
- 5861 Sperry Dr
- 5632 Albert Ln
- 7540 Eastgate Ave
- 7530 Eastgate Ave
- 7546 Eastgate Ave
- 7524 Eastgate Ave
- 7552 Eastgate Ave
- 5700 Southview Ct
- 7535 Eastgate Ave
- 7529 Eastgate Ave
- 7539 Eastgate Ave
- 7518 Eastgate Ave
- 5706 Southview Ct
- 5651 Mariposa Ave
- 7558 Eastgate Ave
- 7512 Eastgate Ave
- 5712 Southview Ct
- 7557 Eastgate Ave
- 7507 Eastgate Ave
- 5718 Southview Ct
- 7506 Eastgate Ave
- 5707 Southview Ct