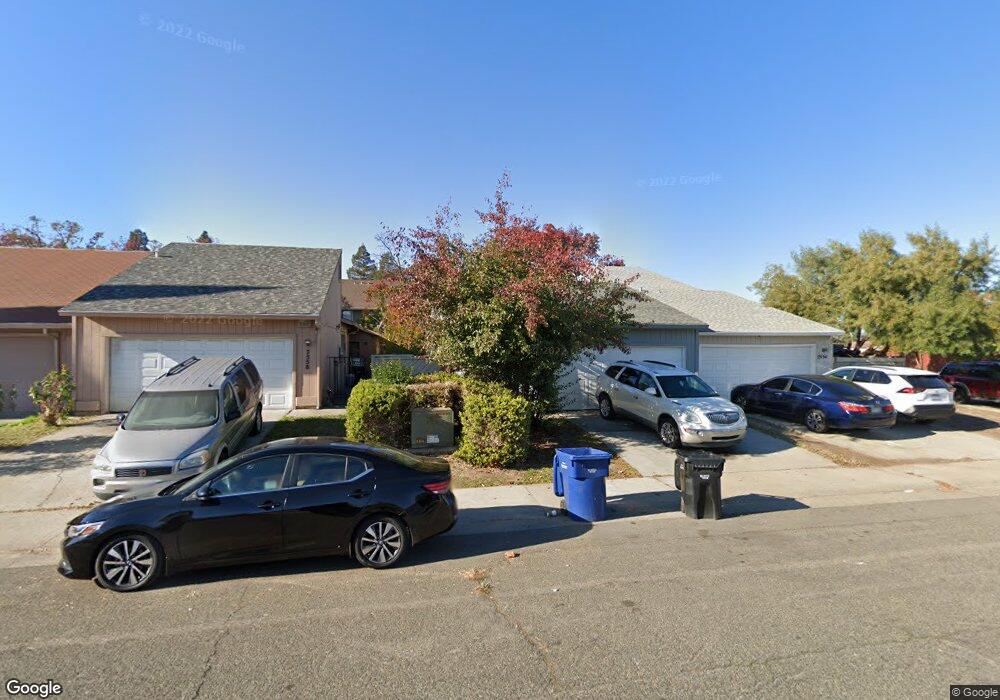
7556 Waterwillow Dr Sacramento, CA 95828
Estimated Value: $282,000 - $361,000
3
Beds
2
Baths
1,126
Sq Ft
$286/Sq Ft
Est. Value
About This Home
This home is located at 7556 Waterwillow Dr, Sacramento, CA 95828 and is currently estimated at $322,555, approximately $286 per square foot. 7556 Waterwillow Dr is a home located in Sacramento County with nearby schools including David Reese Elementary School, James Rutter Middle School, and Florin High School.
Ownership History
Date
Name
Owned For
Owner Type
Purchase Details
Closed on
Apr 30, 2016
Sold by
Fung Florence Y and Florence Y Fung Trust
Bought by
D Lei Sac Llc
Current Estimated Value
Purchase Details
Closed on
Jun 4, 2015
Sold by
Ira Services Trust Co Cf
Bought by
Sans Ventures Llc
Purchase Details
Closed on
Apr 19, 2011
Sold by
Federal Home Loan Mortgage Corporation
Bought by
Fung Florence Y
Purchase Details
Closed on
Dec 29, 2010
Sold by
Cobos Eduardo and Cobos Elizabeth
Bought by
Federal Home Loan Mortgage Corporation
Purchase Details
Closed on
Feb 5, 2002
Sold by
Curry Michael E
Bought by
Cobos Eduardo and Cobos Elizabeth
Home Financials for this Owner
Home Financials are based on the most recent Mortgage that was taken out on this home.
Original Mortgage
$113,981
Interest Rate
7.15%
Mortgage Type
FHA
Purchase Details
Closed on
Oct 29, 1993
Sold by
Curry Julian C and Curry Juliane G
Bought by
Curry Michael E
Create a Home Valuation Report for This Property
The Home Valuation Report is an in-depth analysis detailing your home's value as well as a comparison with similar homes in the area
Home Values in the Area
Average Home Value in this Area
Purchase History
| Date | Buyer | Sale Price | Title Company |
|---|---|---|---|
| D Lei Sac Llc | -- | None Available | |
| Sans Ventures Llc | $114,500 | None Available | |
| Fung Florence Y | $59,000 | First American Title Insuran | |
| Federal Home Loan Mortgage Corporation | $99,447 | None Available | |
| Cobos Eduardo | $115,000 | Alliance Title Company | |
| Curry Michael E | -- | -- |
Source: Public Records
Mortgage History
| Date | Status | Borrower | Loan Amount |
|---|---|---|---|
| Previous Owner | Cobos Eduardo | $113,981 | |
| Closed | Cobos Eduardo | $6,900 |
Source: Public Records
Tax History Compared to Growth
Tax History
| Year | Tax Paid | Tax Assessment Tax Assessment Total Assessment is a certain percentage of the fair market value that is determined by local assessors to be the total taxable value of land and additions on the property. | Land | Improvement |
|---|---|---|---|---|
| 2025 | $845 | $75,576 | $12,806 | $62,770 |
| 2024 | $845 | $74,095 | $12,555 | $61,540 |
| 2023 | $824 | $72,643 | $12,309 | $60,334 |
| 2022 | $810 | $71,219 | $12,068 | $59,151 |
| 2021 | $802 | $69,824 | $11,832 | $57,992 |
| 2020 | $791 | $69,109 | $11,711 | $57,398 |
| 2019 | $777 | $67,755 | $11,482 | $56,273 |
| 2018 | $757 | $66,427 | $11,257 | $55,170 |
| 2017 | $744 | $65,126 | $11,037 | $54,089 |
| 2016 | $708 | $63,850 | $10,821 | $53,029 |
| 2015 | $695 | $62,892 | $10,659 | $52,233 |
| 2014 | $684 | $61,661 | $10,451 | $51,210 |
Source: Public Records
Map
Nearby Homes
- 7206 Willowwest Ct
- 7618 Sunvaught Ln
- 7566 Sunmore Ln
- 7598 Sunmore Ln
- 7100 Sunbridge Ln
- 7313 Sunshire Ln
- 7451 Albezzia Ln
- 7548 Huckleberry Ln
- 7309 Sunleaf Ln
- 7551 Red Bud Ln
- 7605 Mctavish Cir
- 7734 Whispering Palms Dr
- 7625 Par Pkwy
- 7633 Clement Cir
- 7413 Skander Way
- 7325 Sunsilver Ln
- 7212 Kallie Kay Ln
- 5906 Stacy Ave
- 7407 Sunborough Ln
- 7700 La Mancha Way
- 7558 Waterwillow Dr
- 7554 Waterwillow Dr
- 7560 Waterwillow Dr
- 7562 Waterwillow Dr
- 7564 Waterwillow Dr
- 7530 Andrewsarah Ct
- 7557 Waterwillow Dr
- 7566 Waterwillow Dr
- 7555 Waterwillow Dr
- 7559 Waterwillow Dr
- 7561 Waterwillow Dr
- 7568 Waterwillow Dr
- 7528 Andrewsarah Ct
- 7565 Waterwillow Dr
- 7531 Andrewsarah Ct
- 7526 Andrewsarah Ct
- 7570 Waterwillow Dr
- 7101 Gerber Rd
- 7567 Waterwillow Dr
- 7529 Andrewsarah Ct