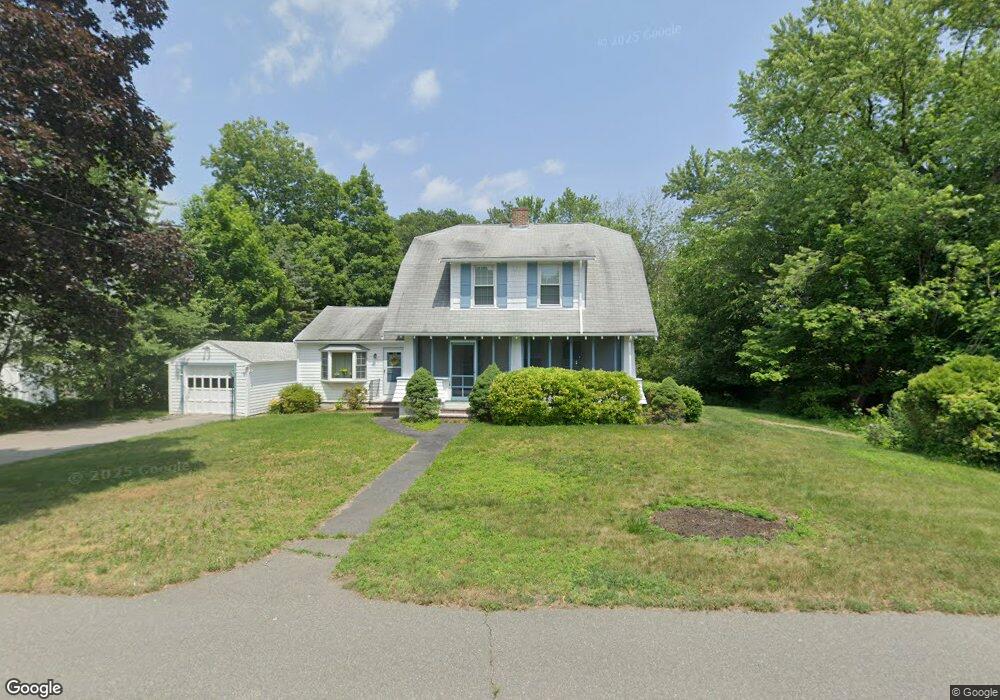
756 South St Bridgewater, MA 02324
Estimated Value: $582,000 - $635,000
3
Beds
3
Baths
1,807
Sq Ft
$338/Sq Ft
Est. Value
About This Home
This home is located at 756 South St, Bridgewater, MA 02324 and is currently estimated at $610,221, approximately $337 per square foot. 756 South St is a home located in Plymouth County with nearby schools including Mitchell Elementary School, Williams Intermediate School, and Bridgewater Middle School.
Ownership History
Date
Name
Owned For
Owner Type
Purchase Details
Closed on
Aug 14, 2015
Sold by
Doherty Paul F and Doherty Mabel E
Bought by
Doherty Ft
Current Estimated Value
Purchase Details
Closed on
Aug 30, 1968
Bought by
Evers-Doherty Beth
Create a Home Valuation Report for This Property
The Home Valuation Report is an in-depth analysis detailing your home's value as well as a comparison with similar homes in the area
Home Values in the Area
Average Home Value in this Area
Purchase History
| Date | Buyer | Sale Price | Title Company |
|---|---|---|---|
| Doherty Ft | -- | -- | |
| Evers-Doherty Beth | $18,000 | -- |
Source: Public Records
Mortgage History
| Date | Status | Borrower | Loan Amount |
|---|---|---|---|
| Previous Owner | Evers-Doherty Beth | $13,000 |
Source: Public Records
Tax History Compared to Growth
Tax History
| Year | Tax Paid | Tax Assessment Tax Assessment Total Assessment is a certain percentage of the fair market value that is determined by local assessors to be the total taxable value of land and additions on the property. | Land | Improvement |
|---|---|---|---|---|
| 2025 | $6,042 | $510,700 | $196,700 | $314,000 |
| 2024 | $5,875 | $483,900 | $187,300 | $296,600 |
| 2023 | $5,963 | $464,400 | $175,000 | $289,400 |
| 2022 | $5,775 | $403,300 | $153,600 | $249,700 |
| 2021 | $5,376 | $371,300 | $137,100 | $234,200 |
| 2020 | $5,310 | $360,500 | $131,800 | $228,700 |
| 2019 | $5,351 | $350,200 | $131,800 | $218,400 |
| 2018 | $10,061 | $329,300 | $128,000 | $201,300 |
| 2017 | $4,943 | $308,700 | $128,000 | $180,700 |
| 2016 | $4,620 | $297,300 | $125,500 | $171,800 |
| 2015 | $4,622 | $284,600 | $121,800 | $162,800 |
| 2014 | $4,498 | $276,800 | $118,300 | $158,500 |
Source: Public Records
Map
Nearby Homes
- 50 Stephanie Ln
- 35 Stockbridge Rd
- 165 Grange Park
- 489 Flagg St
- 54 Grange Park
- 220 Bedford St Unit D-5
- 88 Boxwood Ln
- 8 North St
- 74 Vernon St
- 29 Leonard St Unit 29
- 130 Maple Ave
- 74 Mount Prospect St
- 25 Evergreen Dr
- 331 North St
- 585 Forest St
- 16 Cassidy Place Unit 16
- Lot 3 Fontana Way
- Lot 2 Fontana Way
- 0 Flagg St Unit 73421818
- 180 Main St Unit 2208