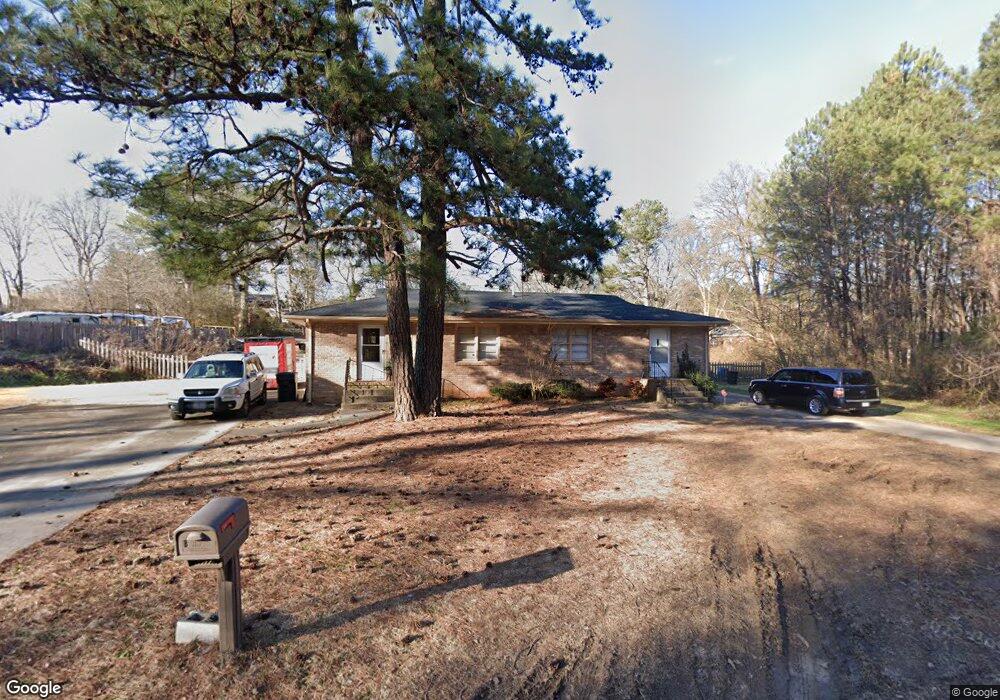
756 Sunset Blvd SW Unit 758 Mableton, GA 30126
Estimated Value: $262,000 - $308,000
4
Beds
2
Baths
1,431
Sq Ft
$194/Sq Ft
Est. Value
About This Home
This home is located at 756 Sunset Blvd SW Unit 758, Mableton, GA 30126 and is currently estimated at $277,928, approximately $194 per square foot. 756 Sunset Blvd SW Unit 758 is a home located in Cobb County with nearby schools including Clay-Harmony Leland Elementary School, Lindley Middle School, and Pebblebrook High School.
Ownership History
Date
Name
Owned For
Owner Type
Purchase Details
Closed on
Oct 6, 2021
Sold by
Benjamin Phillips
Bought by
Jg Homes Ii Llc
Current Estimated Value
Purchase Details
Closed on
Sep 27, 2013
Sold by
Federal National Mortgage Association
Bought by
Phillips Benjamin
Purchase Details
Closed on
Jul 9, 2013
Sold by
Regions Bank
Bought by
Federal National Mtg Associati
Purchase Details
Closed on
Jul 2, 2013
Sold by
Porter Marlene
Bought by
Regions Bank
Purchase Details
Closed on
Oct 12, 2007
Sold by
Williams Lisa M and Williams Christopher
Bought by
Porter Marlene
Home Financials for this Owner
Home Financials are based on the most recent Mortgage that was taken out on this home.
Original Mortgage
$106,000
Interest Rate
6.44%
Mortgage Type
New Conventional
Create a Home Valuation Report for This Property
The Home Valuation Report is an in-depth analysis detailing your home's value as well as a comparison with similar homes in the area
Home Values in the Area
Average Home Value in this Area
Purchase History
| Date | Buyer | Sale Price | Title Company |
|---|---|---|---|
| Jg Homes Ii Llc | -- | Georgia Wills Trusts & Probate | |
| Phillips Benjamin | $50,000 | -- | |
| Federal National Mtg Associati | -- | -- | |
| Regions Bank | $106,000 | -- | |
| Porter Marlene | $132,500 | -- |
Source: Public Records
Mortgage History
| Date | Status | Borrower | Loan Amount |
|---|---|---|---|
| Previous Owner | Porter Marlene | $106,000 |
Source: Public Records
Tax History Compared to Growth
Tax History
| Year | Tax Paid | Tax Assessment Tax Assessment Total Assessment is a certain percentage of the fair market value that is determined by local assessors to be the total taxable value of land and additions on the property. | Land | Improvement |
|---|---|---|---|---|
| 2025 | $2,318 | $76,934 | $34,008 | $42,926 |
| 2024 | $2,416 | $80,140 | $34,008 | $46,132 |
| 2023 | $2,157 | $71,528 | $34,008 | $37,520 |
| 2022 | $1,598 | $52,640 | $21,480 | $31,160 |
| 2021 | $1,375 | $45,292 | $18,616 | $26,676 |
| 2020 | $1,244 | $40,996 | $14,320 | $26,676 |
| 2019 | $1,244 | $40,996 | $14,320 | $26,676 |
| 2018 | $997 | $32,864 | $8,232 | $24,632 |
| 2017 | $685 | $23,840 | $5,368 | $18,472 |
| 2016 | $685 | $23,840 | $5,368 | $18,472 |
| 2015 | $686 | $23,284 | $3,580 | $19,704 |
| 2014 | $517 | $17,400 | $0 | $0 |
Source: Public Records
Map
Nearby Homes
- 5981 Pisgah Rd SW
- Harbor Plan at Mableton Station
- Robie Plan at Mableton Station
- Aisle Plan at Mableton Station
- Elston Plan at Mableton Station
- 6243 Honeybell Alley
- KNOLLWOOD Plan at Mableton Station - Townhomes
- 5777 Whispering Pines Rd SW
- 6266 Britt Rd SW
- 6281 Denny Ln SW
- 6251 Honeybell Alley
- 489 Lee Rd SW
- 767 Kenneth Ln SW
- 846 Orris Ln SW
- 586 Ridge Ave SW
- 537 Elizabeth Ln SW
- 1034 Bettina Ct SW
- 1031 Bettina Ct SW
- 496 Elizabeth Ln SW
- 5859 Lone Oak Dr SW
- 756 Sunset Blvd SW
- 5974 Louise Place SW
- 5991 Pisgah Rd SW
- 6011 Pisgah Rd SW
- 759 Sunset Blvd SW
- 5862 Louise Place SW
- 5986 Louise Place SW
- 765 Old Alabama Rd SW
- 628 Denny Ln SW
- 5971 Pisgah Rd SW
- 690 Congressional Ct
- 755 Old Alabama Rd SW
- 775 Old Alabama Rd SW
- 741 Old Alabama Rd SW Unit 8
- 741 Old Alabama Rd SW
- 6025 Pisgah Rd SW
- 6084 Pisgah Rd SW
- 5975 Louise Place SW
- 5961 Louise Place SW
- 5994 Pisgah Rd SW