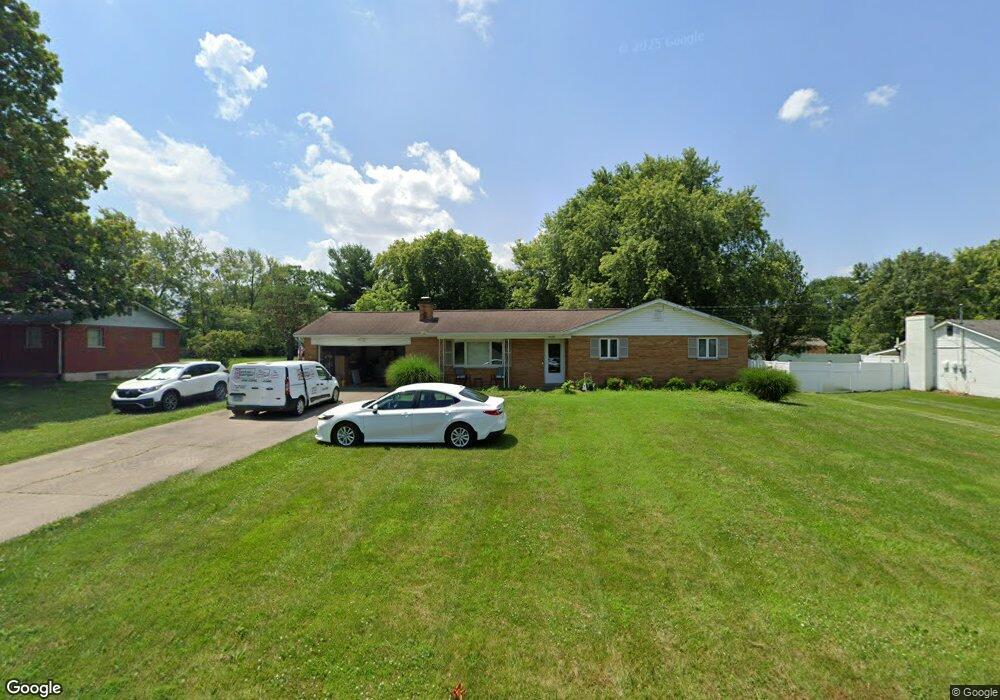
7595 Barret Rd West Chester, OH 45069
West Chester Township NeighborhoodEstimated Value: $285,000 - $327,000
3
Beds
2
Baths
1,329
Sq Ft
$231/Sq Ft
Est. Value
About This Home
This home is located at 7595 Barret Rd, West Chester, OH 45069 and is currently estimated at $306,802, approximately $230 per square foot. 7595 Barret Rd is a home located in Butler County with nearby schools including Hopewell Early Childhood School, Woodland Elementary School, and Hopewell Junior School.
Ownership History
Date
Name
Owned For
Owner Type
Purchase Details
Closed on
Jul 20, 2017
Sold by
Mink Dale E and Mink Pamela S
Bought by
Mink Dale E and Mink Pamela S
Current Estimated Value
Purchase Details
Closed on
Sep 13, 2016
Sold by
Mink Edna B Tr
Bought by
Dale E Mink
Home Financials for this Owner
Home Financials are based on the most recent Mortgage that was taken out on this home.
Interest Rate
3.44%
Purchase Details
Closed on
Aug 2, 2016
Sold by
Mink Dale E and Mink Danny
Bought by
Mink Dale E
Home Financials for this Owner
Home Financials are based on the most recent Mortgage that was taken out on this home.
Interest Rate
3.44%
Purchase Details
Closed on
Feb 2, 2007
Sold by
Mink Edna B and Mink Dale E
Bought by
Mink Edna B and Edna B Mink Trust
Purchase Details
Closed on
Jul 10, 2000
Sold by
Estate Of John C Mink
Bought by
Mink Edna B
Purchase Details
Closed on
Jul 7, 2000
Sold by
Mink Edna B
Bought by
Mink Edna B and Mink Dale E
Create a Home Valuation Report for This Property
The Home Valuation Report is an in-depth analysis detailing your home's value as well as a comparison with similar homes in the area
Home Values in the Area
Average Home Value in this Area
Purchase History
| Date | Buyer | Sale Price | Title Company |
|---|---|---|---|
| Mink Dale E | -- | None Available | |
| Dale E Mink | -- | -- | |
| Mink Dale E | -- | None Available | |
| Mink Edna B | -- | Attorney | |
| Mink Edna B | -- | -- | |
| Mink Edna B | -- | -- |
Source: Public Records
Mortgage History
| Date | Status | Borrower | Loan Amount |
|---|---|---|---|
| Closed | Dale E Mink | -- |
Source: Public Records
Tax History Compared to Growth
Tax History
| Year | Tax Paid | Tax Assessment Tax Assessment Total Assessment is a certain percentage of the fair market value that is determined by local assessors to be the total taxable value of land and additions on the property. | Land | Improvement |
|---|---|---|---|---|
| 2024 | $3,260 | $76,980 | $16,240 | $60,740 |
| 2023 | $3,237 | $82,900 | $16,240 | $66,660 |
| 2022 | $3,321 | $58,560 | $16,240 | $42,320 |
| 2021 | $3,059 | $56,540 | $16,240 | $40,300 |
| 2020 | $3,132 | $56,540 | $16,240 | $40,300 |
| 2019 | $4,910 | $51,240 | $15,930 | $35,310 |
| 2018 | $2,982 | $51,240 | $15,930 | $35,310 |
| 2017 | $3,035 | $51,240 | $15,930 | $35,310 |
| 2016 | $2,857 | $46,590 | $15,930 | $30,660 |
| 2015 | $2,848 | $46,590 | $15,930 | $30,660 |
| 2014 | $3,170 | $46,590 | $15,930 | $30,660 |
| 2013 | $3,170 | $50,340 | $13,540 | $36,800 |
Source: Public Records
Map
Nearby Homes
- 7594 Barret Rd
- 7574 Barret Rd
- 8253 Lake Ridge Dr
- 8309 Cox Rd
- 7541 Granby Way Unit 89
- 8709 Ashbrook Dr
- 7203 Cherrywood Ln
- 8698 Cox Rd
- 8749 Monticello Dr
- 7531 Exchequer Ct
- 7506 Parliament Ct Unit 149
- 7859 Kingsgate Way
- 8430 Meadowlark Ct
- 8608 Goldfinch Way
- 7470 Susan Springs Dr
- 6729 Maverick Dr
- 8851 Old Farm Dr
- 8199 Vadith Ct
- 8500 Crestmont Dr
- 8997 Saxton Dr
- 7605 Barret Rd
- 7587 Barret Rd
- 7579 Barret Rd
- 8432 Ridgecrest Dr
- 7626 Barret Rd
- 8440 Ridgecrest Dr
- 7634 Barret Rd
- 7618 Barret Rd
- 7642 Barret Rd
- 7569 Barret Rd
- 8429 Brookridge Dr
- 7623 Barret Rd
- 7610 Barret Rd
- 8437 Ridgecrest Dr
- 8448 Ridgecrest Dr
- 7650 Barret Rd
- 8437 Brookridge Dr
- 7602 Barret Rd
- 7559 Barret Rd
- 8369 Julie Marie Dr