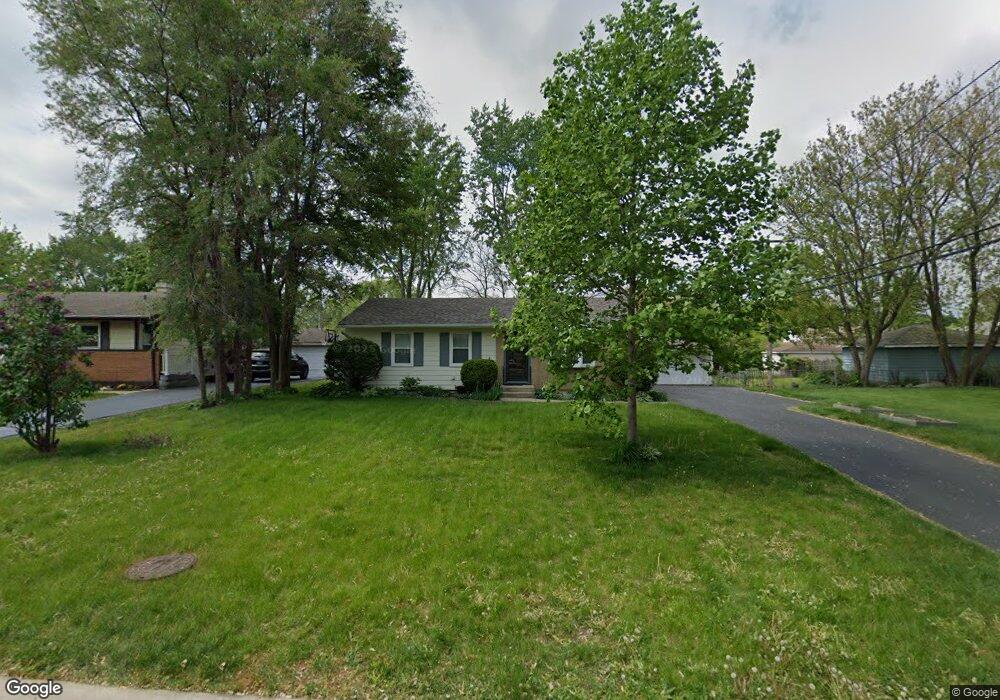
7608 Walnut Ave Woodridge, IL 60517
West 83rd NeighborhoodEstimated Value: $305,000 - $369,000
3
Beds
1
Bath
1,025
Sq Ft
$331/Sq Ft
Est. Value
About This Home
This home is located at 7608 Walnut Ave, Woodridge, IL 60517 and is currently estimated at $338,777, approximately $330 per square foot. 7608 Walnut Ave is a home located in DuPage County with nearby schools including William F. Murphy Elementary School, Thomas Jefferson Junior High School, and Downers Grove South High School.
Ownership History
Date
Name
Owned For
Owner Type
Purchase Details
Closed on
Aug 26, 2008
Sold by
Gagnon Richard R and Gagnon Geraldine A
Bought by
Lathrop Robert L and Lathrop Anna M
Current Estimated Value
Home Financials for this Owner
Home Financials are based on the most recent Mortgage that was taken out on this home.
Original Mortgage
$219,996
Outstanding Balance
$146,538
Interest Rate
6.55%
Mortgage Type
FHA
Estimated Equity
$192,239
Purchase Details
Closed on
Jul 19, 1996
Sold by
Lane Patrick D and Lane Toni L
Bought by
Gagnon Richard R and Bourgeois Geraldine A
Home Financials for this Owner
Home Financials are based on the most recent Mortgage that was taken out on this home.
Original Mortgage
$102,400
Interest Rate
8.33%
Purchase Details
Closed on
Jul 24, 1995
Sold by
Lane Patrick D and Lane Toni L
Bought by
Lane Patrick D and Lane Toni L
Create a Home Valuation Report for This Property
The Home Valuation Report is an in-depth analysis detailing your home's value as well as a comparison with similar homes in the area
Home Values in the Area
Average Home Value in this Area
Purchase History
| Date | Buyer | Sale Price | Title Company |
|---|---|---|---|
| Lathrop Robert L | $224,000 | First American Title Ins Co | |
| Gagnon Richard R | $128,000 | -- | |
| Lane Patrick D | -- | -- |
Source: Public Records
Mortgage History
| Date | Status | Borrower | Loan Amount |
|---|---|---|---|
| Open | Lathrop Robert L | $219,996 | |
| Previous Owner | Gagnon Richard R | $102,400 |
Source: Public Records
Tax History Compared to Growth
Tax History
| Year | Tax Paid | Tax Assessment Tax Assessment Total Assessment is a certain percentage of the fair market value that is determined by local assessors to be the total taxable value of land and additions on the property. | Land | Improvement |
|---|---|---|---|---|
| 2024 | $7,588 | $101,155 | $58,039 | $43,116 |
| 2023 | $7,237 | $92,320 | $52,970 | $39,350 |
| 2022 | $6,517 | $81,700 | $46,880 | $34,820 |
| 2021 | $6,211 | $78,610 | $45,110 | $33,500 |
| 2020 | $6,117 | $77,200 | $44,300 | $32,900 |
| 2019 | $5,924 | $73,860 | $42,380 | $31,480 |
| 2018 | $5,533 | $67,150 | $38,530 | $28,620 |
| 2017 | $5,376 | $64,880 | $37,230 | $27,650 |
| 2016 | $5,273 | $62,530 | $35,880 | $26,650 |
| 2015 | $5,180 | $58,890 | $33,790 | $25,100 |
| 2014 | $5,340 | $58,890 | $33,790 | $25,100 |
| 2013 | $5,258 | $59,030 | $33,870 | $25,160 |
Source: Public Records
Map
Nearby Homes
- 2813 Forest Glen Pkwy
- 7660 Walnut Ave
- 2941 Westridge Dr
- 2849 Crabtree Ave
- 2712 Mohawk Ave
- 7664 Willow Ave
- 2852 Everglade Ave
- 2605 Willow Ave
- 2546 Jonquil Ln
- 7836 Catalpa Ave
- 2732 Davos Ave
- 7830 Westview Ln
- 7924 Westview Ln
- 3012 Scenicwood Ln
- 3 Oakview Ct
- 3011 Scenicwood Ln
- 8040 Geneva St
- 2302 Dalewood Pkwy
- 8119 Leawood Ln
- 7024 Roberts Dr
- 7612 Walnut Ave
- 2801 Forest Glen Pkwy
- 2807 Forest Glen Pkwy
- 7605 Woodridge Dr
- 7616 Walnut Ave
- 7609 Woodridge Dr
- 7613 Woodridge Dr
- 7611 Walnut Ave
- 7605 Walnut Ave
- 2819 Forest Glen Pkwy
- 7615 Walnut Ave
- 7617 Woodridge Dr
- 7620 Walnut Ave
- 2763 Forest Glen Pkwy
- 7619 Walnut Ave
- 7550 Walnut Ave
- 7624 Walnut Ave
- 2830 Forest Glen Pkwy
- 7623 Walnut Ave
- 7541 Walnut Ave