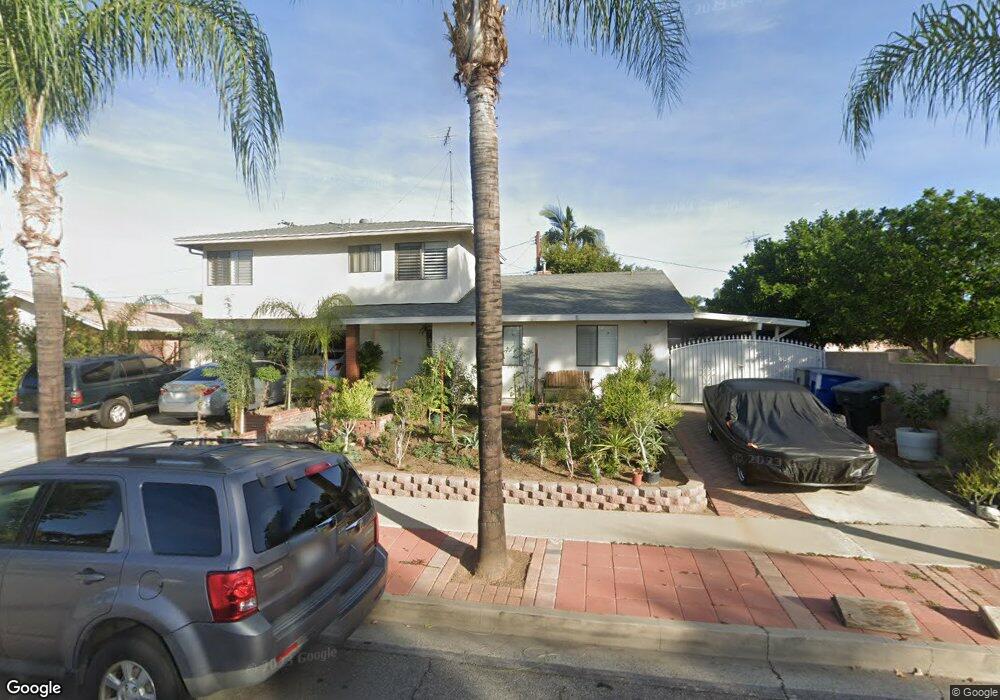
761 E Rose Ave La Habra, CA 90631
Estimated Value: $996,941 - $1,162,000
5
Beds
2
Baths
2,521
Sq Ft
$418/Sq Ft
Est. Value
About This Home
This home is located at 761 E Rose Ave, La Habra, CA 90631 and is currently estimated at $1,053,735, approximately $417 per square foot. 761 E Rose Ave is a home located in Orange County with nearby schools including El Cerrito Elementary School, Arbolita Elementary School, and Washington Middle School.
Ownership History
Date
Name
Owned For
Owner Type
Purchase Details
Closed on
Jun 8, 2012
Sold by
Sandoval Victor and Sandoval Alberta
Bought by
Sandoval Victor and Sandoval Alberta
Current Estimated Value
Home Financials for this Owner
Home Financials are based on the most recent Mortgage that was taken out on this home.
Original Mortgage
$74,800
Outstanding Balance
$51,742
Interest Rate
3.79%
Mortgage Type
New Conventional
Estimated Equity
$1,001,993
Purchase Details
Closed on
Sep 7, 2006
Sold by
Curiel Andres and Curiel Zenaida
Bought by
Sandoval Victorio G and Sandoval Alberta Sanchez
Home Financials for this Owner
Home Financials are based on the most recent Mortgage that was taken out on this home.
Original Mortgage
$120,000
Outstanding Balance
$71,513
Interest Rate
6.53%
Mortgage Type
Purchase Money Mortgage
Estimated Equity
$982,222
Purchase Details
Closed on
Apr 24, 1998
Sold by
Brenes Rios Anthony and Brenes Josefina Brenes
Bought by
Sandoval Victorio G and Sandoval Alberta Sanchez
Home Financials for this Owner
Home Financials are based on the most recent Mortgage that was taken out on this home.
Original Mortgage
$157,500
Interest Rate
7.11%
Create a Home Valuation Report for This Property
The Home Valuation Report is an in-depth analysis detailing your home's value as well as a comparison with similar homes in the area
Home Values in the Area
Average Home Value in this Area
Purchase History
| Date | Buyer | Sale Price | Title Company |
|---|---|---|---|
| Sandoval Victor | -- | Equity Title Company | |
| Sandoval Victorio G | -- | Landamerica Commonwealth Tit | |
| Sandoval Victorio G | $175,000 | Chicago Title Co |
Source: Public Records
Mortgage History
| Date | Status | Borrower | Loan Amount |
|---|---|---|---|
| Open | Sandoval Victor | $74,800 | |
| Open | Sandoval Victorio G | $120,000 | |
| Previous Owner | Sandoval Victorio G | $157,500 |
Source: Public Records
Tax History Compared to Growth
Tax History
| Year | Tax Paid | Tax Assessment Tax Assessment Total Assessment is a certain percentage of the fair market value that is determined by local assessors to be the total taxable value of land and additions on the property. | Land | Improvement |
|---|---|---|---|---|
| 2025 | $5,871 | $521,543 | $404,779 | $116,764 |
| 2024 | $5,871 | $511,317 | $396,842 | $114,475 |
| 2023 | $5,735 | $501,292 | $389,061 | $112,231 |
| 2022 | $5,675 | $491,463 | $381,432 | $110,031 |
| 2021 | $5,582 | $481,827 | $373,953 | $107,874 |
| 2020 | $5,528 | $476,887 | $370,119 | $106,768 |
| 2019 | $5,374 | $467,537 | $362,862 | $104,675 |
| 2018 | $5,282 | $458,370 | $355,747 | $102,623 |
| 2017 | $5,186 | $449,383 | $348,772 | $100,611 |
| 2016 | $5,062 | $440,572 | $341,933 | $98,639 |
| 2015 | $4,916 | $433,955 | $336,797 | $97,158 |
| 2014 | $4,769 | $425,455 | $330,200 | $95,255 |
Source: Public Records
Map
Nearby Homes
- Plan 4 - The Sage at The Birchwoods
- Plan 2 - The Poppy at The Birchwoods
- 994 E La Habra Blvd Unit 246
- 760 N Orange St
- 762 N Orange St
- 764 N Orange St
- 766 N Orange St
- 770 N Orange St
- 1018 E La Habra Blvd Unit 238
- 1400 Eastpark Dr
- 570 E 2nd Ave
- 308 S Valencia St
- 410 N Fonda St
- 1241 Arbolita Dr
- 1100 N Euclid St
- 224 S Fonda St
- 303 S Cadiz Ct
- 1936 Skywood St
- 313 W 1st Ave Unit M
- 950 N Walnut St
- 751 E Rose Ave
- 601 N College St
- 611 N College St
- 760 E Pinehurst Ave
- 750 E Pinehurst Ave
- 741 E Rose Ave
- 740 E Pinehurst Ave
- 750 E Rose Ave
- 760 E Rose Ave
- 740 E Rose Ave
- 770 E Rose Ave
- 730 E Pinehurst Ave
- 621 N Mcpherson St
- 611 N Mcpherson St
- 802 E Greenwood Ave
- 550 N Mcpherson St
- 720 E Pinehurst Ave
- 801 E Rose Ave
- 601 N Mcpherson St
- 551 N College St