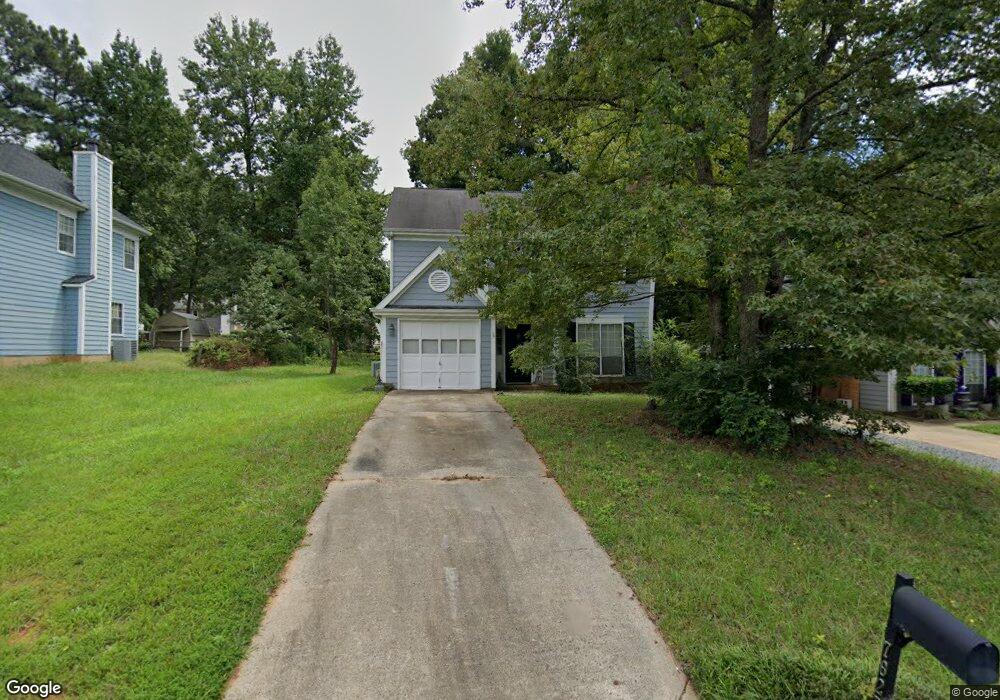
7627 Swedish Ivy Ln Charlotte, NC 28227
Estimated Value: $292,000 - $392,000
3
Beds
3
Baths
1,471
Sq Ft
$224/Sq Ft
Est. Value
About This Home
This home is located at 7627 Swedish Ivy Ln, Charlotte, NC 28227 and is currently estimated at $328,876, approximately $223 per square foot. 7627 Swedish Ivy Ln is a home located in Mecklenburg County with nearby schools including Lebanon Road Elementary, Northeast Middle, and Independence High.
Ownership History
Date
Name
Owned For
Owner Type
Purchase Details
Closed on
Dec 5, 2023
Sold by
John Edwin Fullagar Iii Trust
Bought by
Chester Jonathan David
Current Estimated Value
Purchase Details
Closed on
Nov 9, 2022
Sold by
Windy Baird Pullagar Trust
Bought by
Fullagar John Edwin
Purchase Details
Closed on
Sep 19, 2019
Sold by
Fullagar John E and Fullagar Windy B
Bought by
Fullagar John Edwin and John Edwin Fullagar Iii Trust
Purchase Details
Closed on
May 24, 2013
Sold by
Dunn Rosanne and Muller Rosanne
Bought by
Fullagar John E
Purchase Details
Closed on
Feb 21, 2002
Sold by
Bartolomo Rosanne and Muller Rosanne
Bought by
Muller Rosanne
Home Financials for this Owner
Home Financials are based on the most recent Mortgage that was taken out on this home.
Original Mortgage
$53,000
Interest Rate
7.02%
Mortgage Type
Purchase Money Mortgage
Create a Home Valuation Report for This Property
The Home Valuation Report is an in-depth analysis detailing your home's value as well as a comparison with similar homes in the area
Home Values in the Area
Average Home Value in this Area
Purchase History
| Date | Buyer | Sale Price | Title Company |
|---|---|---|---|
| Chester Jonathan David | $254,000 | Tryon Title | |
| Fullagar John Edwin | -- | -- | |
| Fullagar John Edwin | -- | None Listed On Document | |
| Fullagar John Edwin | -- | None Available | |
| Fullagar John E | $50,000 | None Available | |
| Muller Rosanne | -- | -- |
Source: Public Records
Mortgage History
| Date | Status | Borrower | Loan Amount |
|---|---|---|---|
| Previous Owner | Muller Rosanne | $53,000 |
Source: Public Records
Tax History Compared to Growth
Tax History
| Year | Tax Paid | Tax Assessment Tax Assessment Total Assessment is a certain percentage of the fair market value that is determined by local assessors to be the total taxable value of land and additions on the property. | Land | Improvement |
|---|---|---|---|---|
| 2025 | -- | $278,600 | $60,000 | $218,600 |
| 2024 | -- | $278,600 | $60,000 | $218,600 |
| 2023 | $1,856 | $278,600 | $60,000 | $218,600 |
| 2022 | $1,369 | $156,800 | $30,000 | $126,800 |
| 2021 | $1,369 | $156,800 | $30,000 | $126,800 |
| 2020 | $1,361 | $156,800 | $30,000 | $126,800 |
| 2019 | $1,355 | $156,800 | $30,000 | $126,800 |
| 2018 | $1,092 | $95,200 | $16,200 | $79,000 |
| 2017 | $1,081 | $95,200 | $16,200 | $79,000 |
| 2016 | $1,074 | $95,200 | $16,200 | $79,000 |
| 2015 | $1,061 | $95,200 | $16,200 | $79,000 |
| 2014 | $1,043 | $95,200 | $16,200 | $79,000 |
Source: Public Records
Map
Nearby Homes
- 7601 Swedish Ivy Ln
- 8318 David Lee Ln
- 7201 Stillwell Rd
- 7125 Stillwell Rd
- 7516 Barn Stone Dr
- 3708 Martele Dr
- 4610 Spicewood Dr
- 4600 Spicewood Dr
- 7321 Glenmont Dr
- 4716 Margaret Wallace Rd
- 9830 Spring Harvest Dr
- 7301 Meadow Glen Dr
- 3220 Jonesberry Rd
- 6421 Gold Wagon Ln
- 9909 Idlewild Rd
- 10003 Idlewild Rd
- 7315 Palmetto Ct
- 8748 Twined Creek Ln
- 8659 Wandering Creek Way
- 8602 Twined Creek Ln
- 7621 Swedish Ivy Ln
- 7633 Swedish Ivy Ln
- 8528 Red Setter Ln
- 7615 Swedish Ivy Ln
- 7639 Swedish Ivy Ln
- 8526 Red Setter Ln
- 8351 Houndstooth Dr
- 8348 Houndstooth Dr
- 8520 Red Setter Ln
- 8530 Red Setter Ln
- 7611 Swedish Ivy Ln
- 8514 Red Setter Ln
- 8345 Houndstooth Dr
- 000 Swedish Ivy Ln
- 8342 Houndstooth Dr
- 7614 Swedish Ivy Ln
- 8506 Red Setter Ln
- 8529 Red Setter Ln
- 8338 Houndstooth Dr
- 8500 Red Setter Ln