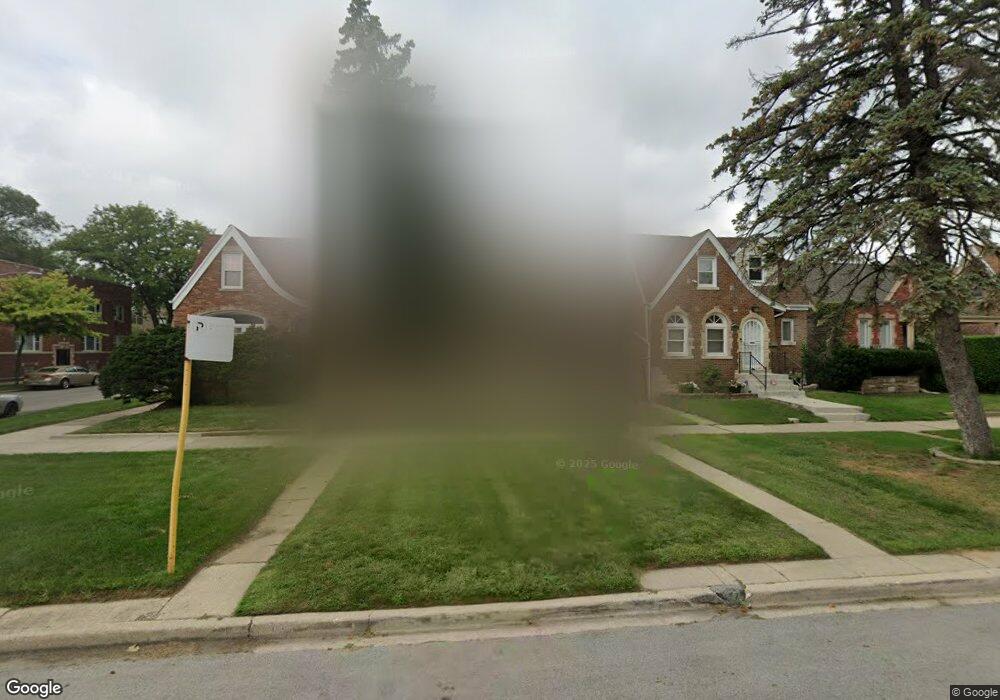
7654 S Calumet Ave Chicago, IL 60619
Park Manor NeighborhoodEstimated Value: $186,000 - $245,093
2
Beds
2
Baths
1,500
Sq Ft
$148/Sq Ft
Est. Value
About This Home
This home is located at 7654 S Calumet Ave, Chicago, IL 60619 and is currently estimated at $221,523, approximately $147 per square foot. 7654 S Calumet Ave is a home located in Cook County with nearby schools including Ruggles Elementary School and Rescue Missionary Christian School.
Ownership History
Date
Name
Owned For
Owner Type
Purchase Details
Closed on
Jun 24, 2022
Sold by
Chicago Title Land Trust Company
Bought by
Shaw Sukhari
Current Estimated Value
Purchase Details
Closed on
Dec 30, 2009
Sold by
Harris Audrey J
Bought by
Park National Bank and Trust #90007
Purchase Details
Closed on
Jul 6, 2009
Sold by
Us Bank National Association
Bought by
Harris Audrey J
Purchase Details
Closed on
Jul 10, 2008
Sold by
Hampton Culver
Bought by
Us Bank Na
Purchase Details
Closed on
Feb 13, 2006
Sold by
Powell Yvette C
Bought by
Hampton Culver
Home Financials for this Owner
Home Financials are based on the most recent Mortgage that was taken out on this home.
Original Mortgage
$141,600
Interest Rate
7.32%
Mortgage Type
Unknown
Purchase Details
Closed on
Feb 1, 2005
Sold by
Bryant Willim
Bought by
Powell Yvette C
Home Financials for this Owner
Home Financials are based on the most recent Mortgage that was taken out on this home.
Original Mortgage
$120,175
Interest Rate
5.8%
Mortgage Type
Unknown
Create a Home Valuation Report for This Property
The Home Valuation Report is an in-depth analysis detailing your home's value as well as a comparison with similar homes in the area
Home Values in the Area
Average Home Value in this Area
Purchase History
| Date | Buyer | Sale Price | Title Company |
|---|---|---|---|
| Shaw Sukhari | -- | Old Republic Title | |
| Park National Bank | -- | None Available | |
| Harris Audrey J | $100,000 | 1St American Title | |
| Us Bank Na | -- | None Available | |
| Hampton Culver | $177,000 | Multiple | |
| Powell Yvette C | $126,500 | Cti |
Source: Public Records
Mortgage History
| Date | Status | Borrower | Loan Amount |
|---|---|---|---|
| Previous Owner | Hampton Culver | $141,600 | |
| Previous Owner | Powell Yvette C | $120,175 |
Source: Public Records
Tax History Compared to Growth
Tax History
| Year | Tax Paid | Tax Assessment Tax Assessment Total Assessment is a certain percentage of the fair market value that is determined by local assessors to be the total taxable value of land and additions on the property. | Land | Improvement |
|---|---|---|---|---|
| 2024 | $3,106 | $14,660 | $3,600 | $11,060 |
| 2023 | $3,763 | $14,721 | $4,800 | $9,921 |
| 2022 | $3,763 | $18,297 | $4,800 | $13,497 |
| 2021 | $3,679 | $18,297 | $4,800 | $13,497 |
| 2020 | $2,610 | $11,716 | $3,840 | $7,876 |
| 2019 | $2,587 | $12,875 | $3,840 | $9,035 |
| 2018 | $2,543 | $12,875 | $3,840 | $9,035 |
| 2017 | $3,231 | $15,011 | $3,360 | $11,651 |
| 2016 | $3,007 | $15,011 | $3,360 | $11,651 |
| 2015 | $2,884 | $15,738 | $3,360 | $12,378 |
| 2014 | $1,743 | $14,127 | $2,880 | $11,247 |
| 2013 | $1,749 | $14,127 | $2,880 | $11,247 |
Source: Public Records
Map
Nearby Homes
- 7627 S Prairie Ave
- 7720 S Prairie Ave
- 7616 S Calumet Ave
- 7741 S Indiana Ave
- 7736 S Indiana Ave
- 7808 S Vernon Ave
- 7635 S Michigan Ave
- 7535 S Vernon Ave
- 7801 S Eberhart Ave
- 7832 S Eberhart Ave
- 7918 S Calumet Ave
- 7744 S Rhodes Ave
- 7817 S Eberhart Ave
- 7619 S Wabash Ave
- 7533 S Eberhart Ave
- 7811 S Wabash Ave
- 7708 S Wabash Ave
- 7658 S Wabash Ave
- 7430 S King Dr
- 7646 S Wabash Ave
- 7658 S Calumet Ave
- 7652 S Calumet Ave
- 7648 S Calumet Ave
- 7646 S Calumet Ave
- 7640 S Calumet Ave
- 7702 S Calumet Ave
- 7638 S Calumet Ave
- 7655 S Prairie Ave
- 7653 S Prairie Ave
- 7659 S Prairie Ave
- 7706 S Calumet Ave
- 7649 S Prairie Ave
- 7634 S Calumet Ave
- 344 E 77th St
- 7647 S Prairie Ave
- 7643 S Prairie Ave
- 7710 S Calumet Ave
- 7701 S Prairie Ave
- 7632 S Calumet Ave
- 7641 S Prairie Ave