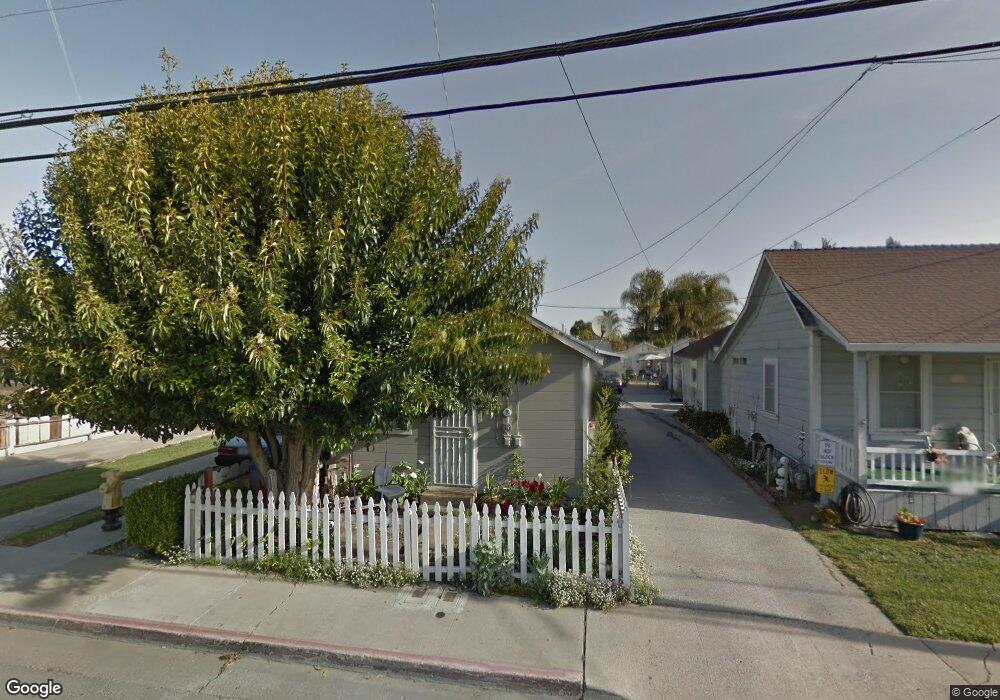
766 South St Hollister, CA 95023
Estimated Value: $608,000 - $700,000
--
Bed
--
Bath
--
Sq Ft
4,617
Sq Ft Lot
About This Home
This home is located at 766 South St, Hollister, CA 95023 and is currently estimated at $658,747. 766 South St is a home located in San Benito County with nearby schools including R. O. Hardin Elementary School, Rancho San Justo School, and San Benito High School.
Ownership History
Date
Name
Owned For
Owner Type
Purchase Details
Closed on
Apr 28, 2023
Sold by
Poudrier Sean and Taylor Brady
Bought by
Poudrier Sean and Poudrier Taylor
Current Estimated Value
Home Financials for this Owner
Home Financials are based on the most recent Mortgage that was taken out on this home.
Original Mortgage
$350,000
Outstanding Balance
$340,634
Interest Rate
6.6%
Mortgage Type
New Conventional
Estimated Equity
$318,113
Purchase Details
Closed on
Dec 28, 2021
Sold by
Paiva John and Paiva Shelly
Bought by
Poudrier Sean and Poudrier Taylor Brady
Home Financials for this Owner
Home Financials are based on the most recent Mortgage that was taken out on this home.
Original Mortgage
$240,000
Interest Rate
3.11%
Mortgage Type
Commercial
Purchase Details
Closed on
Dec 14, 2021
Sold by
Mendoza Richard and The Arthur Mendoza Revocable T
Bought by
Paiva John and Paiva Shelly
Home Financials for this Owner
Home Financials are based on the most recent Mortgage that was taken out on this home.
Original Mortgage
$240,000
Interest Rate
3.11%
Mortgage Type
Commercial
Purchase Details
Closed on
Jul 22, 2019
Sold by
Mendoza Arthur and Gullicksen Rebecca
Bought by
Mendoza Arthur and Arthur Mendoza Revocable Trust
Create a Home Valuation Report for This Property
The Home Valuation Report is an in-depth analysis detailing your home's value as well as a comparison with similar homes in the area
Home Values in the Area
Average Home Value in this Area
Purchase History
| Date | Buyer | Sale Price | Title Company |
|---|---|---|---|
| Poudrier Sean | -- | Cornerstone Title | |
| Poudrier Sean | $300,000 | First American Title Company | |
| Paiva John | $500,000 | Fidelity National Title Co | |
| Mendoza Arthur | -- | None Available |
Source: Public Records
Mortgage History
| Date | Status | Borrower | Loan Amount |
|---|---|---|---|
| Open | Poudrier Sean | $350,000 | |
| Previous Owner | Poudrier Sean | $240,000 |
Source: Public Records
Tax History Compared to Growth
Tax History
| Year | Tax Paid | Tax Assessment Tax Assessment Total Assessment is a certain percentage of the fair market value that is determined by local assessors to be the total taxable value of land and additions on the property. | Land | Improvement |
|---|---|---|---|---|
| 2025 | $5,210 | $408,374 | $254,689 | $153,685 |
| 2023 | $5,210 | $392,518 | $244,800 | $147,718 |
| 2022 | $1,318 | $102,362 | $38,260 | $64,102 |
| 2021 | $1,301 | $100,356 | $37,510 | $62,846 |
| 2020 | $1,306 | $99,328 | $37,126 | $62,202 |
| 2019 | $1,270 | $97,382 | $36,399 | $60,983 |
| 2018 | $1,241 | $95,474 | $35,686 | $59,788 |
| 2017 | $1,225 | $93,603 | $34,987 | $58,616 |
| 2016 | $1,145 | $91,768 | $34,301 | $57,467 |
| 2015 | $1,134 | $90,390 | $33,786 | $56,604 |
| 2014 | $1,068 | $88,621 | $33,125 | $55,496 |
Source: Public Records
Map
Nearby Homes