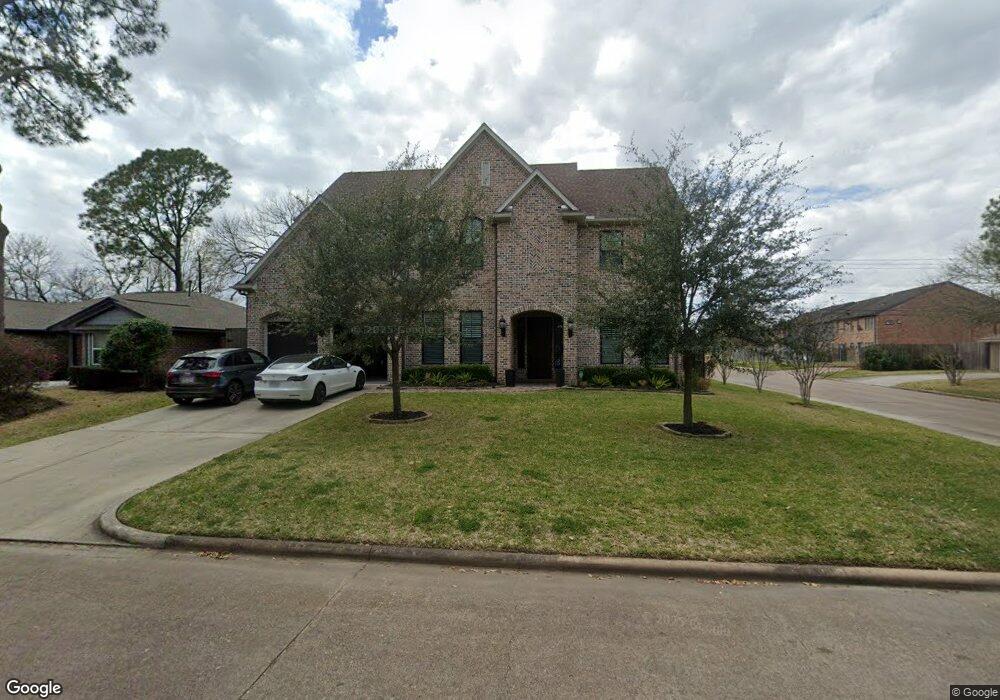
767 Carlingford Ln Houston, TX 77079
Energy Corridor NeighborhoodEstimated Value: $1,277,000 - $1,495,000
5
Beds
4
Baths
4,356
Sq Ft
$321/Sq Ft
Est. Value
About This Home
This home is located at 767 Carlingford Ln, Houston, TX 77079 and is currently estimated at $1,398,323, approximately $321 per square foot. 767 Carlingford Ln is a home located in Harris County with nearby schools including Wilchester Elementary School, Spring Forest Middle School, and Stratford High School.
Ownership History
Date
Name
Owned For
Owner Type
Purchase Details
Closed on
Oct 31, 2016
Sold by
Mount Vernon Contractors Inc
Bought by
Cassalia Jerad K
Current Estimated Value
Home Financials for this Owner
Home Financials are based on the most recent Mortgage that was taken out on this home.
Original Mortgage
$772,000
Outstanding Balance
$621,341
Interest Rate
3.5%
Mortgage Type
New Conventional
Estimated Equity
$776,982
Purchase Details
Closed on
May 14, 2014
Sold by
Fleming Harry B
Bought by
Mount Vernon Contractors Inc
Home Financials for this Owner
Home Financials are based on the most recent Mortgage that was taken out on this home.
Original Mortgage
$225,000
Interest Rate
4.46%
Mortgage Type
Purchase Money Mortgage
Purchase Details
Closed on
Aug 13, 1999
Sold by
Texas Interests Inc
Bought by
Fleming Harry B
Home Financials for this Owner
Home Financials are based on the most recent Mortgage that was taken out on this home.
Original Mortgage
$89,925
Interest Rate
7.68%
Purchase Details
Closed on
Aug 13, 1997
Sold by
Covel William R
Bought by
Texas Interests Inc
Create a Home Valuation Report for This Property
The Home Valuation Report is an in-depth analysis detailing your home's value as well as a comparison with similar homes in the area
Home Values in the Area
Average Home Value in this Area
Purchase History
| Date | Buyer | Sale Price | Title Company |
|---|---|---|---|
| Cassalia Jerad K | $772,000 | Tradition Title Co | |
| Mount Vernon Contractors Inc | -- | Tradition Title Co | |
| Fleming Harry B | -- | First American Title | |
| Texas Interests Inc | -- | -- |
Source: Public Records
Mortgage History
| Date | Status | Borrower | Loan Amount |
|---|---|---|---|
| Open | Cassalia Jerad K | $772,000 | |
| Previous Owner | Mount Vernon Contractors Inc | $225,000 | |
| Previous Owner | Fleming Harry B | $89,925 | |
| Closed | Texas Interests Inc | $0 | |
| Closed | Fleming Harry B | $17,950 |
Source: Public Records
Tax History Compared to Growth
Tax History
| Year | Tax Paid | Tax Assessment Tax Assessment Total Assessment is a certain percentage of the fair market value that is determined by local assessors to be the total taxable value of land and additions on the property. | Land | Improvement |
|---|---|---|---|---|
| 2025 | $20,355 | $1,415,000 | $380,500 | $1,034,500 |
| 2024 | $20,355 | $1,215,329 | $380,500 | $834,829 |
| 2023 | $20,355 | $1,320,048 | $380,500 | $939,548 |
| 2022 | $25,163 | $1,161,860 | $342,450 | $819,410 |
| 2021 | $23,889 | $978,472 | $319,620 | $658,852 |
| 2020 | $23,864 | $952,428 | $319,620 | $632,808 |
| 2019 | $25,595 | $977,652 | $319,620 | $658,032 |
| 2018 | $9,445 | $965,000 | $319,620 | $645,380 |
| 2017 | $25,245 | $965,000 | $319,620 | $645,380 |
| 2016 | $27,469 | $1,050,000 | $319,620 | $730,380 |
| 2015 | $7,585 | $475,182 | $319,620 | $155,562 |
| 2014 | $7,585 | $285,000 | $273,960 | $11,040 |
Source: Public Records
Map
Nearby Homes
- 14102 Pinerock Ln
- 14123 Misty Meadow Ln
- 14171 Misty Meadow Ln
- 14311 Misty Meadow Ln
- 800 Country Place Dr Unit 506
- 800 Country Place Dr Unit 909
- 14387 Misty Meadow Ln
- 14226 Misty Meadow Ln
- 14228 Misty Meadow Ln
- 14143 Lost Meadow Ln
- 1071 Country Place Dr Unit 1071
- 14322 Misty Meadow Ln
- 13931 Kingsride Ln
- 14325 Lost Meadow Ln
- 738 Country Place Dr Unit C
- 726 Country Place Dr Unit C
- 880 Tully Rd Unit 29
- 880 Tully Rd Unit 40
- 880 Tully Rd Unit 28
- 880 Tully Rd Unit 17
- 803 Carlingford Ln
- 759 Carlingford Ln
- 14135 Kimberley Ln
- 755 Carlingford Ln
- 807 Carlingford Ln
- 14134 Kimberley Ln
- 14131 Kimberley Ln
- 14130 Woodthorpe Ln
- 14130 Kimberley Ln
- 14143 Woodthorpe Ln
- 811 Carlingford Ln
- 14127 Kimberley Ln
- 14135 Pinerock Ln
- 14126 Woodthorpe Ln
- 14139 Woodthorpe Ln
- 14126 Kimberley Ln
- 14135 Woodthorpe Ln
- 14131 Pinerock Ln
- 14123 Kimberley Ln
- 14131 Woodthorpe Ln