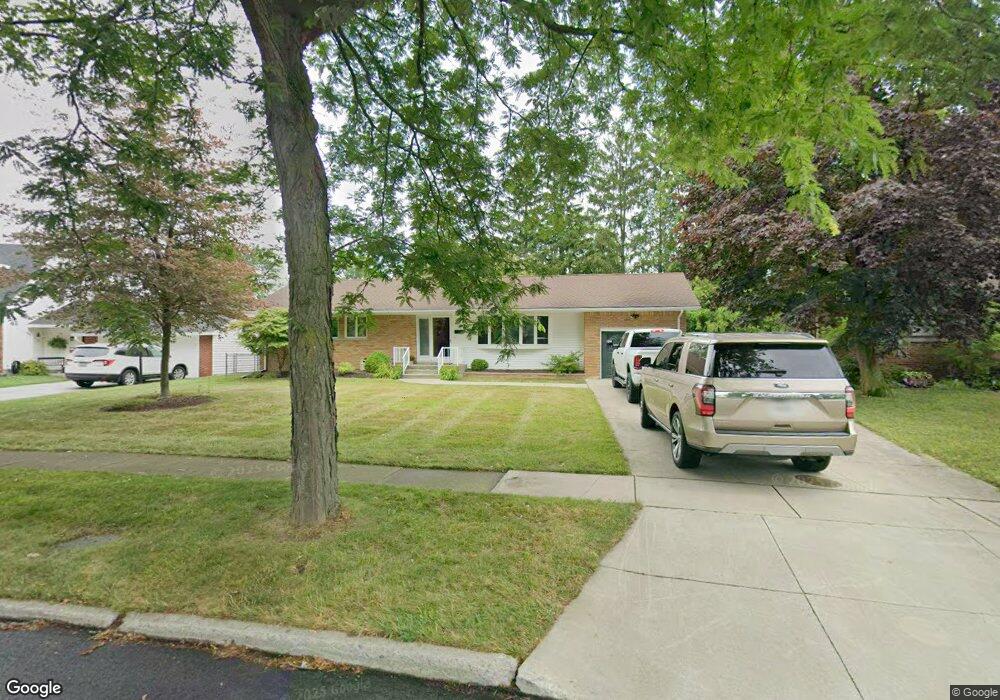
767 Niagara Pkwy North Tonawanda, NY 14120
Estimated Value: $203,000 - $327,000
3
Beds
3
Baths
1,566
Sq Ft
$170/Sq Ft
Est. Value
About This Home
This home is located at 767 Niagara Pkwy, North Tonawanda, NY 14120 and is currently estimated at $266,005, approximately $169 per square foot. 767 Niagara Pkwy is a home located in Niagara County with nearby schools including North Tonawanda Intermediate School, St Matthew Lutheran School, and New Life Christian School.
Ownership History
Date
Name
Owned For
Owner Type
Purchase Details
Closed on
Jun 5, 2025
Sold by
Guido David and Maw Diane M
Bought by
Mangrum Lynda A and Mangrum Scott
Current Estimated Value
Purchase Details
Closed on
Oct 5, 2011
Sold by
Mchugh Nancy L and Edwards Allen E
Bought by
Sionko Raymond and Sionko Marion
Purchase Details
Closed on
May 7, 2009
Sold by
Guido Francis R
Bought by
Guido Francis R and Guido Eleanor L
Home Financials for this Owner
Home Financials are based on the most recent Mortgage that was taken out on this home.
Original Mortgage
$100,000
Interest Rate
4.85%
Mortgage Type
New Conventional
Purchase Details
Closed on
Sep 17, 2004
Sold by
March Michael
Bought by
Guido Francis
Purchase Details
Closed on
Jun 16, 1997
Sold by
Primeau Carol L
Bought by
March Michael D and March Linda
Create a Home Valuation Report for This Property
The Home Valuation Report is an in-depth analysis detailing your home's value as well as a comparison with similar homes in the area
Home Values in the Area
Average Home Value in this Area
Purchase History
| Date | Buyer | Sale Price | Title Company |
|---|---|---|---|
| Mangrum Lynda A | $200,000 | None Listed On Document | |
| Sionko Raymond | $176,500 | None Available | |
| Guido Francis R | -- | None Available | |
| Guido Francis | $123,000 | Michael Argenteri | |
| March Michael D | $99,200 | -- |
Source: Public Records
Mortgage History
| Date | Status | Borrower | Loan Amount |
|---|---|---|---|
| Previous Owner | Guido Francis R | $100,000 |
Source: Public Records
Tax History Compared to Growth
Tax History
| Year | Tax Paid | Tax Assessment Tax Assessment Total Assessment is a certain percentage of the fair market value that is determined by local assessors to be the total taxable value of land and additions on the property. | Land | Improvement |
|---|---|---|---|---|
| 2024 | $4,798 | $135,900 | $29,000 | $106,900 |
| 2023 | $4,679 | $135,900 | $29,000 | $106,900 |
| 2022 | $3,517 | $135,900 | $29,000 | $106,900 |
| 2021 | $3,486 | $135,900 | $29,000 | $106,900 |
| 2020 | $3,316 | $135,900 | $29,000 | $106,900 |
| 2019 | $1,862 | $135,900 | $29,000 | $106,900 |
| 2018 | $3,226 | $135,900 | $29,000 | $106,900 |
| 2017 | $3,144 | $135,900 | $29,000 | $106,900 |
| 2016 | $3,732 | $135,900 | $29,000 | $106,900 |
| 2015 | -- | $135,900 | $29,000 | $106,900 |
| 2014 | -- | $135,900 | $29,000 | $106,900 |
Source: Public Records
Map
Nearby Homes
- 775 Niagara Pkwy
- 763 Niagara Pkwy
- 759 Niagara Pkwy
- 781 Niagara Pkwy
- 776 Niagara Pkwy
- 760 Niagara Pkwy
- 420 Rosebrock St
- 785 Niagara Pkwy
- 427 Esther St
- 394 Rosebrock St
- 792 Niagara Pkwy
- 424 Esther St
- 752 Niagara Pkwy
- 424 Rosebrock St
- 791 Niagara Pkwy
- 437 Esther St
- 387 Walck Rd
- 415 Walck Rd
- 746 Niagara Pkwy
- 421 Walck Rd