
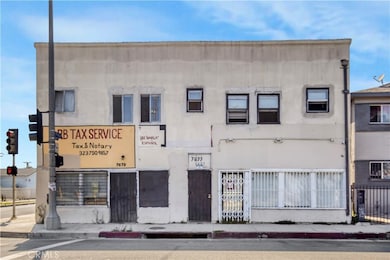
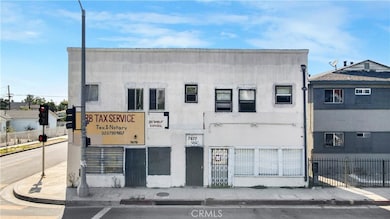
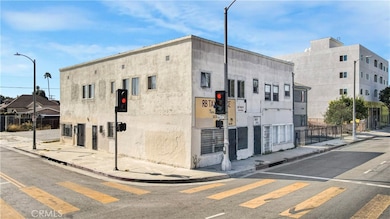
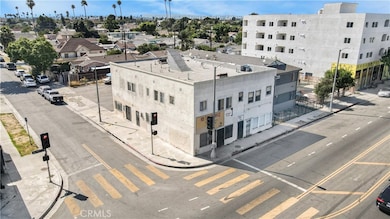
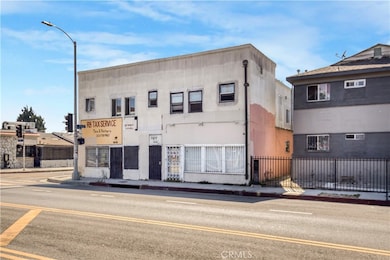
7675 S San Pedro St Los Angeles, CA 90003
Florence NeighborhoodEstimated payment $5,973/month
About This Home
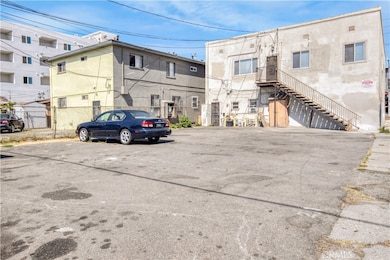
7675 S San Pedro Street presents a prime investment opportunity in the heart of South Los Angeles. This mixed-use property features six total units, including four residential apartments and two ground-floor commercial spaces. With an attractive price per unit of $166,667 and a competitive $203 per square foot, the asset provides investors with strong day-one fundamentals. The property offers immediate income stability with a going-in 8.45 GRM and a solid 7.07% cap rate, making it a well-positioned opportunity for investors seeking reliable cash flow and long-term appreciation. Located along San Pedro Street, the asset benefits from high visibility, consistent foot traffic, and close proximity to major transportation corridors, employment hubs, and neighborhood amenities. With strong in-place income and value-add potential through rental growth, 7675 S San Pedro Street represents a rare opportunity to acquire a well-performing mixed-use property in a dynamic Los Angeles submarket.
Listing Agent
Lyon Stahl Investment Real Estate, Inc. Brokerage Phone: 310-729-1559 License #02100737 Listed on: 09/02/2025

Co-Listing Agent
Lyon Stahl Investment Real Estate, Inc. Brokerage Phone: 310-729-1559 License #01748556
Property Details
Home Type
- Apartment
Est. Annual Taxes
- $8,741
Year Built
- Built in 1925
Lot Details
- 5,526 Sq Ft Lot
- No Common Walls
- Rural Setting
- Density is up to 1 Unit/Acre
Parking
- 14 Car Garage
Home Design
- Entry on the 1st floor
Interior Spaces
- 4,920 Sq Ft Home
- 2-Story Property
Bedrooms and Bathrooms
- 6 Bedrooms
- 4 Bathrooms
Location
- Urban Location
- Suburban Location
Listing and Financial Details
- Tax Lot 156
- Tax Tract Number 1889
- Assessor Parcel Number 6022014005
- $665 per year additional tax assessments
Community Details
Overview
- 6 Units
Building Details
- Rent Control
- 6 Separate Electric Meters
- 6 Separate Gas Meters
- 1 Separate Water Meter
- Operating Expense $41,784
- Gross Income $118,401
- Net Operating Income $70,697
Map
Home Values in the Area
Average Home Value in this Area
Tax History
| Year | Tax Paid | Tax Assessment Tax Assessment Total Assessment is a certain percentage of the fair market value that is determined by local assessors to be the total taxable value of land and additions on the property. | Land | Improvement |
|---|---|---|---|---|
| 2025 | $8,741 | $686,595 | $406,201 | $280,394 |
| 2024 | $8,741 | $673,134 | $398,237 | $274,897 |
| 2023 | $8,580 | $659,936 | $390,429 | $269,507 |
| 2022 | $8,196 | $646,997 | $382,774 | $264,223 |
| 2021 | $8,073 | $634,312 | $375,269 | $259,043 |
| 2019 | $7,839 | $615,500 | $364,140 | $251,360 |
| 2018 | $7,760 | $603,432 | $357,000 | $246,432 |
| 2016 | $5,910 | $456,862 | $167,516 | $289,346 |
| 2015 | $5,829 | $450,000 | $165,000 | $285,000 |
| 2014 | $4,069 | $294,261 | $114,759 | $179,502 |
Property History
| Date | Event | Price | List to Sale | Price per Sq Ft | Prior Sale |
|---|---|---|---|---|---|
| 09/02/2025 09/02/25 | For Sale | $1,000,000 | +69.0% | $203 / Sq Ft | |
| 05/31/2017 05/31/17 | Sold | $591,600 | -1.4% | $120 / Sq Ft | View Prior Sale |
| 03/30/2017 03/30/17 | Pending | -- | -- | -- | |
| 03/13/2017 03/13/17 | For Sale | $599,888 | +33.3% | $122 / Sq Ft | |
| 07/25/2014 07/25/14 | Sold | $450,000 | 0.0% | $91 / Sq Ft | View Prior Sale |
| 06/24/2014 06/24/14 | Pending | -- | -- | -- | |
| 06/05/2014 06/05/14 | For Sale | $450,000 | -- | $91 / Sq Ft |
Purchase History
| Date | Type | Sale Price | Title Company |
|---|---|---|---|
| Grant Deed | -- | Provident Title | |
| Grant Deed | $592,000 | Wfg National Title Co Of Ca | |
| Grant Deed | $450,000 | Wfg Title Company | |
| Interfamily Deed Transfer | -- | -- |
Mortgage History
| Date | Status | Loan Amount | Loan Type |
|---|---|---|---|
| Open | $885,000 | Commercial | |
| Previous Owner | $443,000 | Commercial | |
| Previous Owner | $292,500 | Commercial |
Source: California Regional Multiple Listing Service (CRMLS)
MLS Number: SB25197263
APN: 6022-014-005
Disclaimer: Certain information contained herein is derived from information provided by parties other than Homes.com. All information provided is deemed reliable, but is not guaranteed to be accurate and should be independently verified.
![]() The multiple listing data appearing on this website, or contained in reports produced therefrom, is owned and copyrighted by California Regional Multiple Listing Service, Inc. ("CRMLS") and is protected by all applicable copyright laws. Information provided is for viewer's personal, non-commercial use and may not be used for any purpose other than to identify prospective properties the viewer may be interested in purchasing. All listing data, including but not limited to square footage and lot size is believed to be accurate, but the listing Agent, listing Broker and CRMLS and its affiliates do not warrant or guarantee such accuracy. The viewer should independently verify the listed data prior to making any decisions based on such information by personal inspection and/or contacting a real estate professional.
The multiple listing data appearing on this website, or contained in reports produced therefrom, is owned and copyrighted by California Regional Multiple Listing Service, Inc. ("CRMLS") and is protected by all applicable copyright laws. Information provided is for viewer's personal, non-commercial use and may not be used for any purpose other than to identify prospective properties the viewer may be interested in purchasing. All listing data, including but not limited to square footage and lot size is believed to be accurate, but the listing Agent, listing Broker and CRMLS and its affiliates do not warrant or guarantee such accuracy. The viewer should independently verify the listed data prior to making any decisions based on such information by personal inspection and/or contacting a real estate professional.
Based on information from California Regional Multiple Listing Service, Inc. and /or other sources. All data, including all measurements and calculations of area, is obtained from various sources and has not been, and will not be, verified by broker or MLS. All information should be independently reviewed and verified for accuracy. Properties may or may not be listed by the office/agent presenting the information
- 214 E 76th Place
- 135 E 77th St
- 230 E 75th St
- 8019 Towne Ave
- 7908 Towne Ave
- 124 E 74th St
- 7402 Avalon Blvd
- 127 E 81st St
- 253 E 82nd St
- 8021 Towne Ave
- 215 E 73rd St
- 613 E 76th Place
- 7516 Avalon Blvd
- 8110 S San Pedro St
- 628 E 76th Place
- 203 W 77th St
- 210 W 77th St
- 8111 S Main St
- 201 W 75th St
- 146 E 83rd St
- 7833 Towne Ave
- 132 E 79th St
- 426 E 79th St Unit 1
- 310 E 81st St
- 7510 Avalon Blvd Unit 7512
- 155 W 77th St
- 148 W 79th St
- 8251 S San Pedro St Unit 4
- 204 W 78th St
- 133 W 74th St
- 120 W 73rd St
- 423 E 82nd St Unit 3
- 410 E 82nd St Unit 2
- 719 E 79th St Unit 1
- 140 W 82nd St
- 229 E 84th St
- 321 E 84th St Unit 321
- 407 E 70th St
- 342 E 84th St Unit 1
- 739 E 79th St