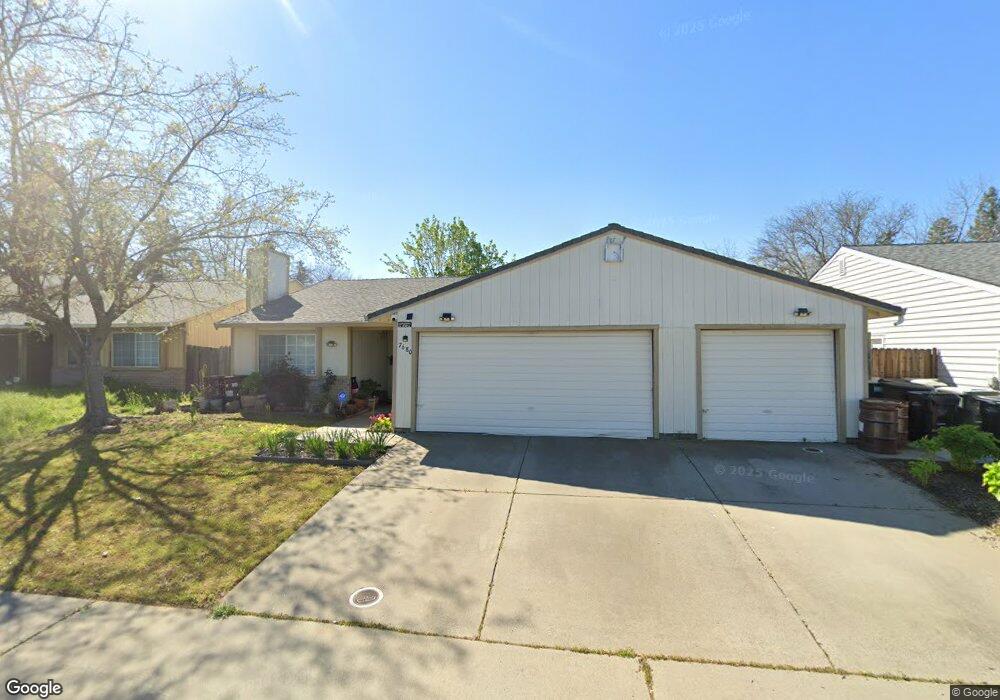
7680 Tea Berry Way Sacramento, CA 95828
Estimated Value: $352,000 - $456,000
3
Beds
2
Baths
1,294
Sq Ft
$327/Sq Ft
Est. Value
About This Home
This home is located at 7680 Tea Berry Way, Sacramento, CA 95828 and is currently estimated at $423,295, approximately $327 per square foot. 7680 Tea Berry Way is a home located in Sacramento County with nearby schools including Mary Tsukamoto Elementary School, T. R. Smedberg Middle School, and Sheldon High School.
Ownership History
Date
Name
Owned For
Owner Type
Purchase Details
Closed on
Sep 2, 2015
Sold by
Lai Li Bing
Bought by
Lai Li Bing and Li Bing Lai Revocable Trust
Current Estimated Value
Purchase Details
Closed on
Dec 16, 2011
Sold by
Shan Jackie
Bought by
Lai Li Bing and Luo Joan Liqiong
Purchase Details
Closed on
May 19, 2011
Sold by
Federal Home Loan Mortgage Corporation
Bought by
Shan Jackie and Lai Li Bing
Purchase Details
Closed on
Aug 10, 2010
Sold by
Lewis Betty J
Bought by
Federal Home Loan Mortgage Corporation
Purchase Details
Closed on
Nov 1, 2005
Sold by
Nguyen Son T and Nguyen Thu Lan T
Bought by
Lewis Betty J
Home Financials for this Owner
Home Financials are based on the most recent Mortgage that was taken out on this home.
Original Mortgage
$304,200
Interest Rate
5.74%
Mortgage Type
Fannie Mae Freddie Mac
Create a Home Valuation Report for This Property
The Home Valuation Report is an in-depth analysis detailing your home's value as well as a comparison with similar homes in the area
Home Values in the Area
Average Home Value in this Area
Purchase History
| Date | Buyer | Sale Price | Title Company |
|---|---|---|---|
| Lai Li Bing | -- | None Available | |
| Lai Li Bing | -- | None Available | |
| Shan Jackie | $105,000 | Ticor Title Riverside | |
| Federal Home Loan Mortgage Corporation | $131,000 | Accommodation | |
| Lewis Betty J | $338,000 | Chicago Title Company |
Source: Public Records
Mortgage History
| Date | Status | Borrower | Loan Amount |
|---|---|---|---|
| Previous Owner | Lewis Betty J | $304,200 |
Source: Public Records
Tax History Compared to Growth
Tax History
| Year | Tax Paid | Tax Assessment Tax Assessment Total Assessment is a certain percentage of the fair market value that is determined by local assessors to be the total taxable value of land and additions on the property. | Land | Improvement |
|---|---|---|---|---|
| 2025 | $1,605 | $134,459 | $38,420 | $96,039 |
| 2024 | $1,605 | $131,823 | $37,667 | $94,156 |
| 2023 | $1,568 | $129,239 | $36,929 | $92,310 |
| 2022 | $1,544 | $126,705 | $36,205 | $90,500 |
| 2021 | $1,528 | $124,222 | $35,496 | $88,726 |
| 2020 | $1,510 | $122,950 | $35,133 | $87,817 |
| 2019 | $1,485 | $120,541 | $34,445 | $86,096 |
| 2018 | $1,449 | $118,178 | $33,770 | $84,408 |
| 2017 | $1,427 | $115,861 | $33,108 | $82,753 |
| 2016 | $1,362 | $113,590 | $32,459 | $81,131 |
| 2015 | $1,339 | $111,885 | $31,972 | $79,913 |
| 2014 | $1,319 | $109,694 | $31,346 | $78,348 |
Source: Public Records
Map
Nearby Homes
- 0 Lakewood Rd
- 8617 Oldwoods Way
- 7753 Southland Way
- 7714 Southland Way
- 7711 Lakewood Park Dr
- 7605 Lakewood Park Dr
- 8609 Tiogawoods Dr
- 175 Skybrook Ln
- 8541 Still Woods Ct
- 8695 Esperia Way
- 7604 Eastbreeze Cir
- 7565 El Terraza Dr
- 110 Wyndbrook St
- 7637 Eastbreeze Cir
- 98 Cantabrook St
- 134 Security Ln
- 87 Bainbrook St
- 92 Bainbrook St
- 8733 Nakota Way
- 8572 German Dr
- 7676 Tea Berry Way
- 7684 Tea Berry Way
- 7672 Tea Berry Way
- 7701 Tea Berry Way
- 8660 Tea Garden Ct
- 7668 Tea Berry Way
- 7705 Tea Berry Way
- 8664 Tea Garden Ct
- 7700 Tea Berry Way
- 7657 Valley Wood Dr
- 7664 Tea Berry Way
- 7704 Tea Berry Way
- 7709 Tea Berry Way
- 8668 Tea Garden Ct
- 7653 Valley Wood Dr
- 7660 Tea Berry Way
- 8653 Prairiewoods Dr
- 7708 Tea Berry Way
- 8665 Tea Garden Ct
- 8657 Prairiewoods Dr