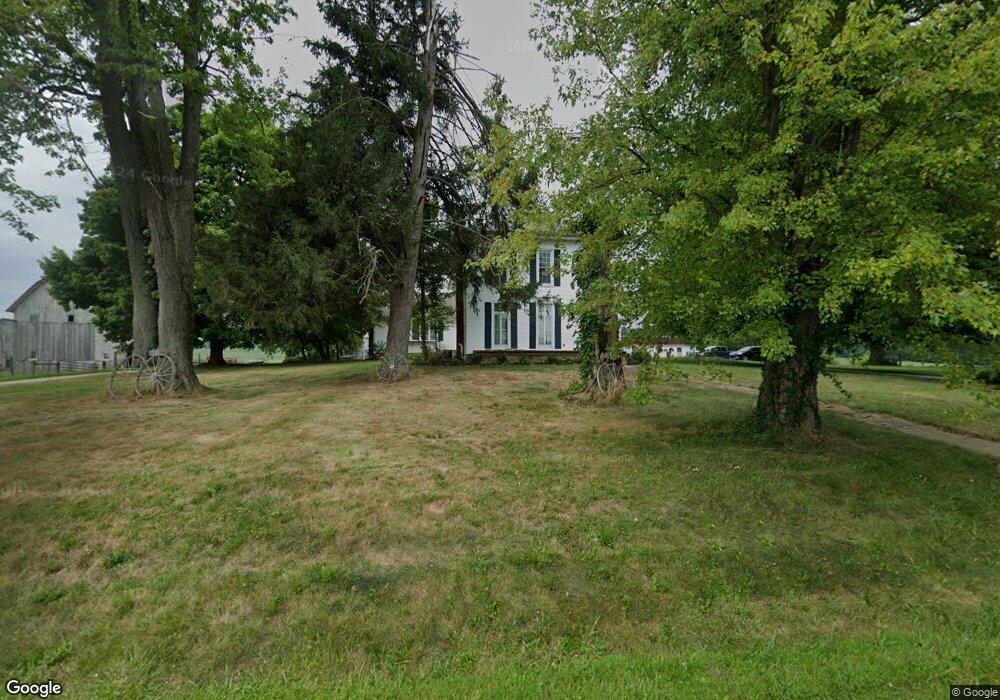
7689 Lock Rd Centerburg, OH 43011
Estimated Value: $662,000 - $1,301,501
4
Beds
2
Baths
3,424
Sq Ft
$256/Sq Ft
Est. Value
About This Home
This home is located at 7689 Lock Rd, Centerburg, OH 43011 and is currently estimated at $875,875, approximately $255 per square foot. 7689 Lock Rd is a home located in Knox County with nearby schools including Centerburg Elementary School and Centerburg High School.
Ownership History
Date
Name
Owned For
Owner Type
Purchase Details
Closed on
Aug 8, 2025
Sold by
Bentz Wright Properties Llc
Bought by
Bentz Jason
Current Estimated Value
Purchase Details
Closed on
Aug 16, 2019
Sold by
Bentz William B
Bought by
Bentz Wright Properties
Home Financials for this Owner
Home Financials are based on the most recent Mortgage that was taken out on this home.
Original Mortgage
$130,000
Interest Rate
3.8%
Mortgage Type
Balloon
Purchase Details
Closed on
Feb 19, 2004
Sold by
Bentz William Byrne
Bought by
Bentz William Byrne
Purchase Details
Closed on
Jan 29, 2004
Sold by
Bentz William Byrne
Bought by
Bentz William Byrne
Purchase Details
Closed on
Dec 12, 2003
Sold by
Bentz William Byrne
Bought by
Bentz William Byrne
Create a Home Valuation Report for This Property
The Home Valuation Report is an in-depth analysis detailing your home's value as well as a comparison with similar homes in the area
Home Values in the Area
Average Home Value in this Area
Purchase History
| Date | Buyer | Sale Price | Title Company |
|---|---|---|---|
| Bentz Jason | $2,700 | None Listed On Document | |
| Bentz Jason | $2,700 | None Listed On Document | |
| Bentz Natalie | $2,700 | None Listed On Document | |
| Bentz Natalie | $2,700 | None Listed On Document | |
| Bentz Wright Properties | $482,200 | -- | |
| Bentz Wright Properties | $482,200 | -- | |
| Bentz William Byrne | -- | -- | |
| Bentz William Byrne | -- | -- | |
| Bentz William Byrne | -- | -- |
Source: Public Records
Mortgage History
| Date | Status | Borrower | Loan Amount |
|---|---|---|---|
| Previous Owner | Bentz Wright Properties | $130,000 | |
| Previous Owner | Bentz Wright Properties | $350,000 |
Source: Public Records
Tax History Compared to Growth
Tax History
| Year | Tax Paid | Tax Assessment Tax Assessment Total Assessment is a certain percentage of the fair market value that is determined by local assessors to be the total taxable value of land and additions on the property. | Land | Improvement |
|---|---|---|---|---|
| 2024 | $6,770 | $293,980 | $210,570 | $83,410 |
| 2023 | $6,770 | $293,980 | $210,570 | $83,410 |
| 2022 | $4,923 | $224,410 | $160,740 | $63,670 |
| 2021 | $4,923 | $224,410 | $160,740 | $63,670 |
| 2020 | $4,496 | $224,410 | $160,740 | $63,670 |
| 2019 | $4,538 | $169,190 | $129,120 | $40,070 |
| 2018 | $4,126 | $147,120 | $107,090 | $40,030 |
| 2017 | $3,785 | $147,120 | $107,090 | $40,030 |
| 2016 | $4,379 | $127,930 | $93,120 | $34,810 |
| 2015 | $4,186 | $127,930 | $93,120 | $34,810 |
| 2014 | $4,194 | $128,260 | $93,120 | $35,140 |
| 2013 | $2,858 | $125,430 | $85,820 | $39,610 |
Source: Public Records
Map
Nearby Homes
- 0 Larimore Rd
- 3959 Johnstown Rd
- 7020 Bennington Chapel Rd
- 001 Marion Rd NW
- 0 Johnstown Rd Unit Sec 13, Tract 5
- 0 Johnstown Rd Unit 20250514
- 9470 Butcher Rd
- 9730 Butcher Rd
- 5679 White Rd
- 4804 Marion Rd NW
- 8263 Bennington Chapel Rd
- 8301 Bennington Chapel Rd
- 4682 Webster Rd
- 0 Johnstown Rd Unit 225026692
- 13303 Douglas Lane Rd
- 0 Krause Rd Unit 225038328
- 9426 Bennington Chapel Rd
- 9240 Sycamore Rd
- 4453 Cardan Ln
- 15228 Croton Rd