77 Chmura Rd Hadley, MA 01035
Estimated Value: $561,000 - $699,000
2
Beds
2
Baths
1,440
Sq Ft
$419/Sq Ft
Est. Value
About This Home
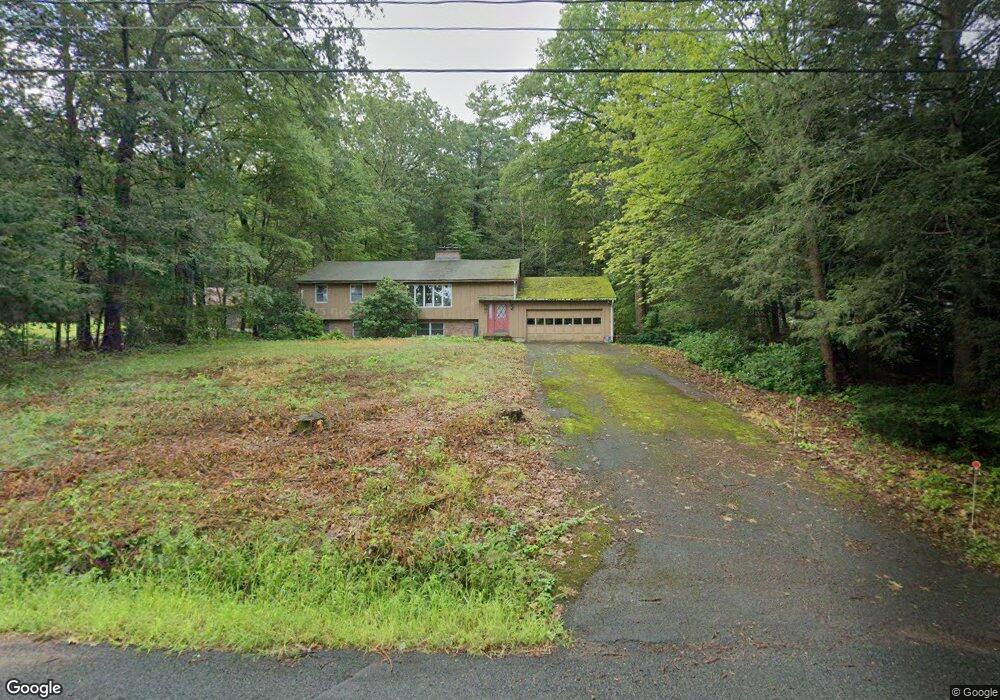
This home is located at 77 Chmura Rd, Hadley, MA 01035 and is currently estimated at $603,443, approximately $419 per square foot. 77 Chmura Rd is a home located in Hampshire County with nearby schools including Hadley Elementary School and The Hartsbrook School.
Ownership History
Date
Name
Owned For
Owner Type
Purchase Details
Closed on
Oct 15, 2004
Sold by
Gavron Maria
Bought by
Scott Elayna D
Current Estimated Value
Home Financials for this Owner
Home Financials are based on the most recent Mortgage that was taken out on this home.
Original Mortgage
$100,000
Outstanding Balance
$49,746
Interest Rate
5.63%
Estimated Equity
$553,697
Create a Home Valuation Report for This Property
The Home Valuation Report is an in-depth analysis detailing your home's value as well as a comparison with similar homes in the area
Home Values in the Area
Average Home Value in this Area
Purchase History
| Date | Buyer | Sale Price | Title Company |
|---|---|---|---|
| Scott Elayna D | $329,900 | -- |
Source: Public Records
Mortgage History
| Date | Status | Borrower | Loan Amount |
|---|---|---|---|
| Open | Scott Elayna D | $100,000 | |
| Closed | Scott Elayna D | $100,000 | |
| Previous Owner | Scott Elayna D | $10,000 | |
| Previous Owner | Scott Elayna D | $50,000 |
Source: Public Records
Tax History Compared to Growth
Tax History
| Year | Tax Paid | Tax Assessment Tax Assessment Total Assessment is a certain percentage of the fair market value that is determined by local assessors to be the total taxable value of land and additions on the property. | Land | Improvement |
|---|---|---|---|---|
| 2025 | $5,260 | $452,300 | $134,500 | $317,800 |
| 2024 | $4,976 | $436,900 | $134,500 | $302,400 |
| 2023 | $4,824 | $418,000 | $134,500 | $283,500 |
| 2022 | $4,487 | $368,400 | $134,500 | $233,900 |
| 2021 | $4,421 | $368,400 | $134,500 | $233,900 |
| 2020 | $4,483 | $350,800 | $134,500 | $216,300 |
| 2019 | $4,343 | $313,600 | $134,500 | $179,100 |
| 2018 | $3,706 | $306,500 | $134,500 | $172,000 |
| 2017 | $3,474 | $300,300 | $134,500 | $165,800 |
| 2016 | $3,348 | $300,300 | $134,500 | $165,800 |
| 2015 | $3,261 | $300,300 | $134,500 | $165,800 |
| 2014 | $3,195 | $300,300 | $134,500 | $165,800 |
Source: Public Records
Map
Nearby Homes