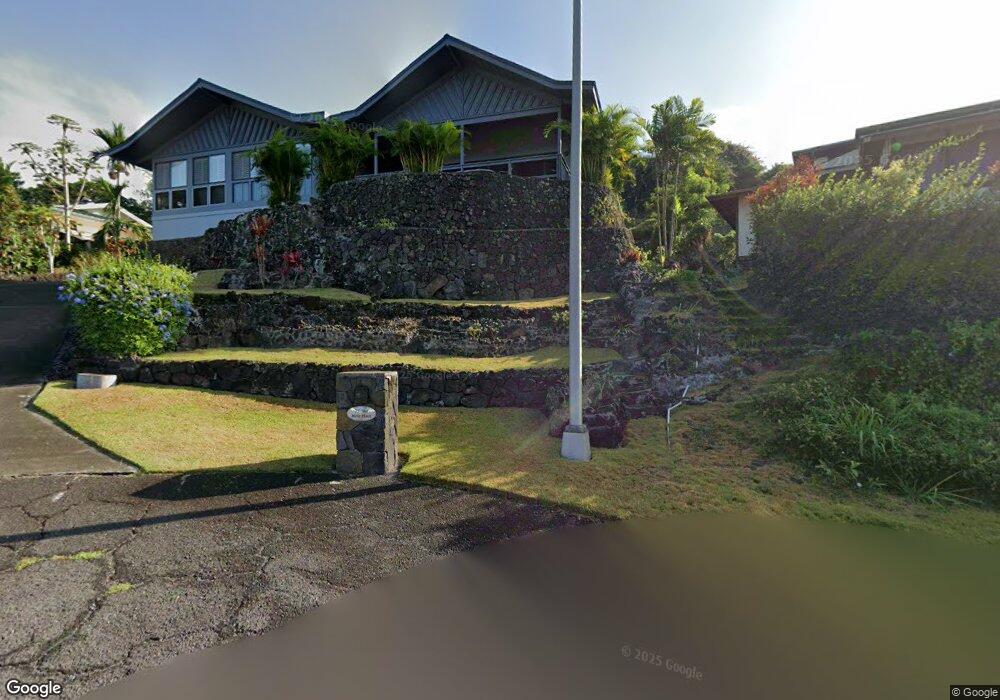
77 Mele Place Kailua Kona, HI 96740
Estimated Value: $1,497,851 - $2,006,000
4
Beds
3
Baths
1,996
Sq Ft
$826/Sq Ft
Est. Value
About This Home
This home is located at 77 Mele Place, Kailua Kona, HI 96740 and is currently estimated at $1,647,713, approximately $825 per square foot. 77 Mele Place is a home with nearby schools including Kahakai Elementary School, Konawaena Middle School, and Konawaena High School.
Ownership History
Date
Name
Owned For
Owner Type
Purchase Details
Closed on
Sep 29, 2022
Sold by
Hofelich Howard Robert
Bought by
Howard Robert Hofelich Trust
Current Estimated Value
Purchase Details
Closed on
Jun 5, 2019
Sold by
Brisbane James A and Brisbane James Anthony
Bought by
Hofelich Howard Robert
Home Financials for this Owner
Home Financials are based on the most recent Mortgage that was taken out on this home.
Original Mortgage
$710,000
Interest Rate
4.1%
Mortgage Type
VA
Purchase Details
Closed on
Aug 17, 2004
Sold by
Ashihara Wayne M and Ashihara Florence N
Bought by
Brisbane James A
Home Financials for this Owner
Home Financials are based on the most recent Mortgage that was taken out on this home.
Original Mortgage
$543,200
Interest Rate
5.75%
Mortgage Type
Purchase Money Mortgage
Create a Home Valuation Report for This Property
The Home Valuation Report is an in-depth analysis detailing your home's value as well as a comparison with similar homes in the area
Home Values in the Area
Average Home Value in this Area
Purchase History
| Date | Buyer | Sale Price | Title Company |
|---|---|---|---|
| Howard Robert Hofelich Trust | -- | -- | |
| Hofelich Howard Robert | $710,000 | Fnt | |
| Brisbane James A | $679,000 | -- |
Source: Public Records
Mortgage History
| Date | Status | Borrower | Loan Amount |
|---|---|---|---|
| Previous Owner | Hofelich Howard Robert | $710,000 | |
| Previous Owner | Brisbane James A | $543,200 | |
| Closed | Brisbane James A | $67,900 |
Source: Public Records
Tax History Compared to Growth
Tax History
| Year | Tax Paid | Tax Assessment Tax Assessment Total Assessment is a certain percentage of the fair market value that is determined by local assessors to be the total taxable value of land and additions on the property. | Land | Improvement |
|---|---|---|---|---|
| 2025 | $100 | $1,487,700 | $384,300 | $1,103,400 |
| 2024 | $100 | $1,435,000 | $384,300 | $1,050,700 |
| 2023 | $100 | $1,361,500 | $384,300 | $977,200 |
| 2022 | $100 | $795,100 | $288,400 | $506,700 |
| 2021 | $100 | $674,500 | $230,700 | $443,800 |
| 2020 | $100 | $641,000 | $217,500 | $423,500 |
| 2019 | $6,508 | $586,300 | $207,200 | $379,100 |
| 2018 | $5,836 | $525,800 | $203,100 | $322,700 |
| 2017 | $5,725 | $515,800 | $200,400 | $315,400 |
| 2016 | $4,909 | $488,500 | $180,400 | $308,100 |
| 2015 | -- | $434,200 | $172,800 | $261,400 |
| 2014 | -- | $425,300 | $163,800 | $261,500 |
Source: Public Records
Map
Nearby Homes
- 77-363 Paulina Place
- 77-300 Hookaana St
- 77-533 Ohi A Ai Place
- 77-6596 Walua Rd
- 78-6737 Walua Rd
- 77 Mamalahoa Hwy
- 77-221 Hoomohala Rd
- 78-6781 Walua Rd
- 77-216 Hoowaiwai Ct
- 77-210 Kapukapu St
- 77-296 Kalani Way Unit 7
- 77-145 Kalaniuka St
- 78-6954-A Walua Rd
- 77-6471 Kilohana St
- 77-301 Noelani Way Unit 12
- 77-6128-B Hawai?i Belt Rd
- 77-6451 Marlin Rd
- 77-6585 Sea View Cir Unit 104
- 77-6452 Leilani St
- 77-159 Hoohonua Ct
- 77-361 Mele Place
- 77-350 Paulina Place
- 77-353 Ainanani St
- 77-356 Paulina Place
- 77-349 Ainanani St
- 77-363 Mele Place
- 77-347 Paulina Place
- 77-360 Paulina Place
- 77-350 Ainanani St
- 77-346 Ainanani St
- 77-362 Paulina Place
- 77-353 Paulina Place
- 77-362 Mele Place
- 77-360 Mele Place
- 77-349 Paulina Place
- 77-355 Paulina Place
- 77-356 Ainanani St
- 77-364 Paulina Place
- 77-407 Ainanani St
- 77-410 Ainanani St