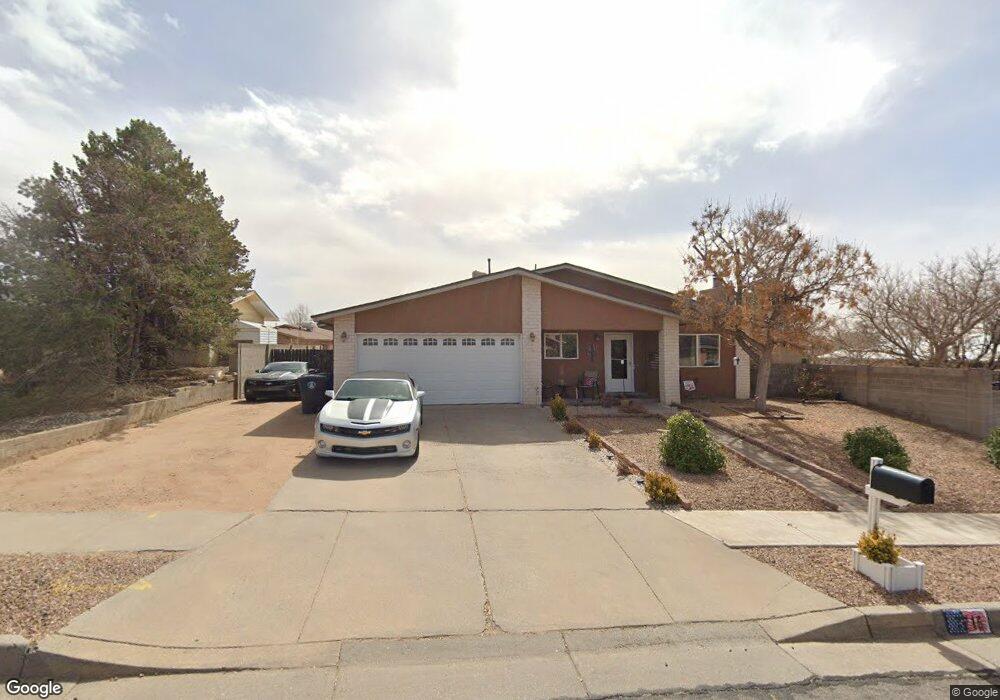
7716 Calle de Cobre NE Albuquerque, NM 87109
North Wyoming NeighborhoodEstimated Value: $387,000 - $412,068
4
Beds
2
Baths
1,640
Sq Ft
$242/Sq Ft
Est. Value
About This Home
This home is located at 7716 Calle de Cobre NE, Albuquerque, NM 87109 and is currently estimated at $397,517, approximately $242 per square foot. 7716 Calle de Cobre NE is a home located in Bernalillo County with nearby schools including Edmund G Ross Elementary School, McKinley Middle School, and Del Norte High School.
Ownership History
Date
Name
Owned For
Owner Type
Purchase Details
Closed on
Apr 27, 2017
Sold by
Alexander Lan M and Donoghue Michelle
Bought by
Alexander Lan M
Current Estimated Value
Home Financials for this Owner
Home Financials are based on the most recent Mortgage that was taken out on this home.
Original Mortgage
$190,272
Outstanding Balance
$160,618
Interest Rate
4.75%
Mortgage Type
FHA
Estimated Equity
$236,899
Purchase Details
Closed on
Sep 24, 2008
Sold by
Alexander Ian M and Donoghue Michelle
Bought by
Alexander Ian M
Home Financials for this Owner
Home Financials are based on the most recent Mortgage that was taken out on this home.
Original Mortgage
$171,100
Interest Rate
6.52%
Mortgage Type
FHA
Purchase Details
Closed on
May 9, 2002
Sold by
Bibbey Jeffrey A and Bibbey Paula M
Bought by
Alexander Ian and Donoghue Michele
Home Financials for this Owner
Home Financials are based on the most recent Mortgage that was taken out on this home.
Original Mortgage
$130,945
Interest Rate
7.1%
Mortgage Type
FHA
Create a Home Valuation Report for This Property
The Home Valuation Report is an in-depth analysis detailing your home's value as well as a comparison with similar homes in the area
Home Values in the Area
Average Home Value in this Area
Purchase History
| Date | Buyer | Sale Price | Title Company |
|---|---|---|---|
| Alexander Lan M | -- | Stewart Title | |
| Alexander Ian M | -- | New Mexico Title Company | |
| Alexander Ian | -- | Rio Grande Title Company Inc |
Source: Public Records
Mortgage History
| Date | Status | Borrower | Loan Amount |
|---|---|---|---|
| Open | Alexander Lan M | $190,272 | |
| Closed | Alexander Ian M | $171,100 | |
| Closed | Alexander Ian | $130,945 |
Source: Public Records
Tax History Compared to Growth
Tax History
| Year | Tax Paid | Tax Assessment Tax Assessment Total Assessment is a certain percentage of the fair market value that is determined by local assessors to be the total taxable value of land and additions on the property. | Land | Improvement |
|---|---|---|---|---|
| 2025 | $3,480 | $84,965 | $14,798 | $70,167 |
| 2024 | $3,480 | $82,491 | $14,367 | $68,124 |
| 2023 | $3,422 | $80,088 | $13,949 | $66,139 |
| 2022 | $3,307 | $77,756 | $13,543 | $64,213 |
| 2021 | $3,196 | $75,491 | $13,148 | $62,343 |
| 2020 | $3,144 | $73,292 | $12,765 | $60,527 |
| 2019 | $3,077 | $71,762 | $14,367 | $57,395 |
| 2018 | $2,968 | $71,762 | $14,367 | $57,395 |
| 2017 | $2,877 | $69,672 | $13,949 | $55,723 |
| 2016 | $2,794 | $65,673 | $13,148 | $52,525 |
| 2015 | $63,760 | $63,760 | $12,765 | $50,995 |
| 2014 | $2,707 | $63,760 | $12,765 | $50,995 |
| 2013 | -- | $63,760 | $12,765 | $50,995 |
Source: Public Records
Map
Nearby Homes
- 7500 Burke St NE
- 7500 Loma Del Norte Rd NE
- 8000 Loma Del Norte Rd NE
- 7339 Natalie Janae Ln NE
- 7109 Derickson Ave NE
- 7401 Scotts Place NE
- 8217 Colfax Ave NE
- 7232 Gallinas Ave NE
- 0 Jemez Place Unit 1084210
- 8233 Otero Ave NE
- 6820 Frantz Dr NE
- 7613 Jemez St NE
- 6808 Frantz Dr NE
- 8305 Portales St NE
- 6831 Jade Park Ave NE
- 8320 Parrot Run Rd NE
- 7235 Whippoorwill Ln NE
- 7712 Leanne St NE
- 8320 Cherry Hills Dr NE
- 6909 Welton Dr NE
- 7800 Calle de Cobre NE
- 7701 Calle de Plata NE
- 7809 Calle de Plata NE
- 7709 Calle de Plata NE
- 7815 Calle de Plata NE
- 7806 Calle de Cobre NE
- 7715 Calle de Cobre NE
- 7709 Calle de Cobre NE
- 7801 Calle de Cobre NE
- 7817 Calle de Plata NE
- 7805 Calle de Cobre NE
- 7405 Calle de Oro NE
- 7401 Calle de Oro NE
- 7705 Calle de Cobre NE
- 7809 Calle de Cobre NE
- 7704 Calle de Plata NE
- 7305 Calle de Oro NE
- 7808 Calle de Plata NE
- 7804 Cll de Plata NE
- 7708 Calle de Plata NE