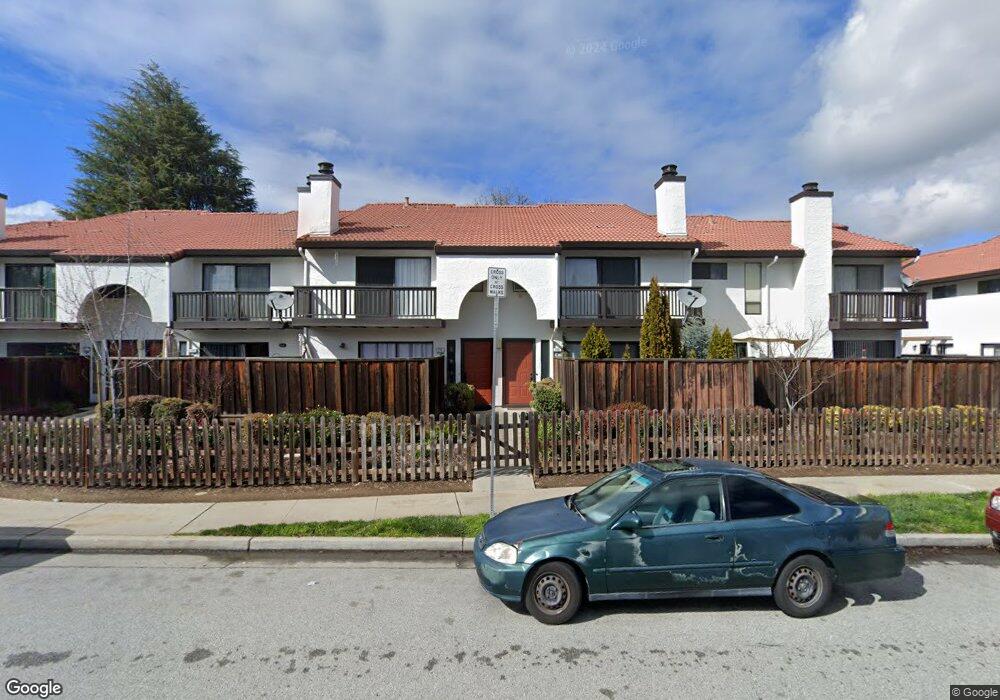
774 Gettysburg Way Gilroy, CA 95020
Estimated Value: $648,000 - $743,000
2
Beds
3
Baths
1,645
Sq Ft
$424/Sq Ft
Est. Value
About This Home
This home is located at 774 Gettysburg Way, Gilroy, CA 95020 and is currently estimated at $697,988, approximately $424 per square foot. 774 Gettysburg Way is a home located in Santa Clara County with nearby schools including Glen View Elementary School, Solorsano Middle School, and Gilroy High School.
Ownership History
Date
Name
Owned For
Owner Type
Purchase Details
Closed on
Jun 17, 2004
Sold by
Rodarte Rafael and Rodarte Julie G
Bought by
Tonog Jennifer
Current Estimated Value
Home Financials for this Owner
Home Financials are based on the most recent Mortgage that was taken out on this home.
Original Mortgage
$318,500
Outstanding Balance
$158,818
Interest Rate
6.3%
Mortgage Type
Purchase Money Mortgage
Estimated Equity
$539,170
Purchase Details
Closed on
Feb 25, 2002
Sold by
Kurowsky Chester J
Bought by
Rodarte Rafael and Rodarte Julie G
Home Financials for this Owner
Home Financials are based on the most recent Mortgage that was taken out on this home.
Original Mortgage
$289,275
Interest Rate
6.37%
Purchase Details
Closed on
Apr 11, 1995
Sold by
Filice Ernest E and Filice Patty
Bought by
Kurowski Chester J
Home Financials for this Owner
Home Financials are based on the most recent Mortgage that was taken out on this home.
Original Mortgage
$136,300
Interest Rate
8.6%
Create a Home Valuation Report for This Property
The Home Valuation Report is an in-depth analysis detailing your home's value as well as a comparison with similar homes in the area
Home Values in the Area
Average Home Value in this Area
Purchase History
| Date | Buyer | Sale Price | Title Company |
|---|---|---|---|
| Tonog Jennifer | $360,000 | Chicago Title | |
| Rodarte Rafael | $304,500 | Chicago Title Co | |
| Kurowski Chester J | $143,500 | Chicago Title Company |
Source: Public Records
Mortgage History
| Date | Status | Borrower | Loan Amount |
|---|---|---|---|
| Open | Tonog Jennifer | $318,500 | |
| Previous Owner | Rodarte Rafael | $289,275 | |
| Previous Owner | Kurowski Chester J | $136,300 |
Source: Public Records
Tax History Compared to Growth
Tax History
| Year | Tax Paid | Tax Assessment Tax Assessment Total Assessment is a certain percentage of the fair market value that is determined by local assessors to be the total taxable value of land and additions on the property. | Land | Improvement |
|---|---|---|---|---|
| 2025 | $6,149 | $511,829 | $213,261 | $298,568 |
| 2024 | $6,149 | $501,794 | $209,080 | $292,714 |
| 2023 | $6,112 | $491,956 | $204,981 | $286,975 |
| 2022 | $6,011 | $482,311 | $200,962 | $281,349 |
| 2021 | $5,984 | $472,855 | $197,022 | $275,833 |
| 2020 | $5,918 | $468,007 | $195,002 | $273,005 |
| 2019 | $5,861 | $458,831 | $191,179 | $267,652 |
| 2018 | $5,471 | $449,835 | $187,431 | $262,404 |
| 2017 | $5,586 | $441,015 | $183,756 | $257,259 |
| 2016 | $5,470 | $432,368 | $180,153 | $252,215 |
| 2015 | $4,858 | $401,000 | $167,100 | $233,900 |
| 2014 | -- | $354,000 | $147,500 | $206,500 |
Source: Public Records
Map
Nearby Homes
- 773 Gettysburg Way
- 738 Gettysburg Way
- 775 Williamsburg Way Unit B
- 771 Williamsburg Way Unit C
- 895 Greenwich Dr
- 7035 Yorktown Dr
- 7245 Trenton Place
- 500 W 10th St Unit 10
- 500 W 10th St Unit 29
- 500 W 10th St Unit 61
- 500 W 10th St Unit 73
- 7210 Yorktown Dr
- 7343 Princevalle St Unit Homesite 19
- Plan 2 at Heritage on 6th Street
- Plan 1 at Heritage on 6th Street
- 7352 Ailes Ct Unit Homesite 7
- 7363 Ailes Ct Unit Homesite 5
- 7351 Princevalle St Unit Homesite 18
- 7360 Ailes Ct Unit Homesite 8
- 7371 Ailes Ct Unit Homesite 4
- 778 Gettysburg Way
- 772 Gettysburg Way
- 782 Gettysburg Way
- 768 Gettysburg Way
- 784 Gettysburg Way
- 7024 Mount Vernon Way
- 762 Gettysburg Way
- 764 Gettysburg Way
- 7027 Mount Vernon Way
- 7034 Mount Vernon Way
- 7037 Mount Vernon Way
- 779 Gettysburg Way
- 7010 Valley Forge Dr
- 7044 Mount Vernon Way
- 7020 Valley Forge Dr
- 775 Gettysburg Way
- 7054 Mount Vernon Way
- 7047 Mount Vernon Way
- 7064 Mount Vernon Way
- 7030 Valley Forge Dr