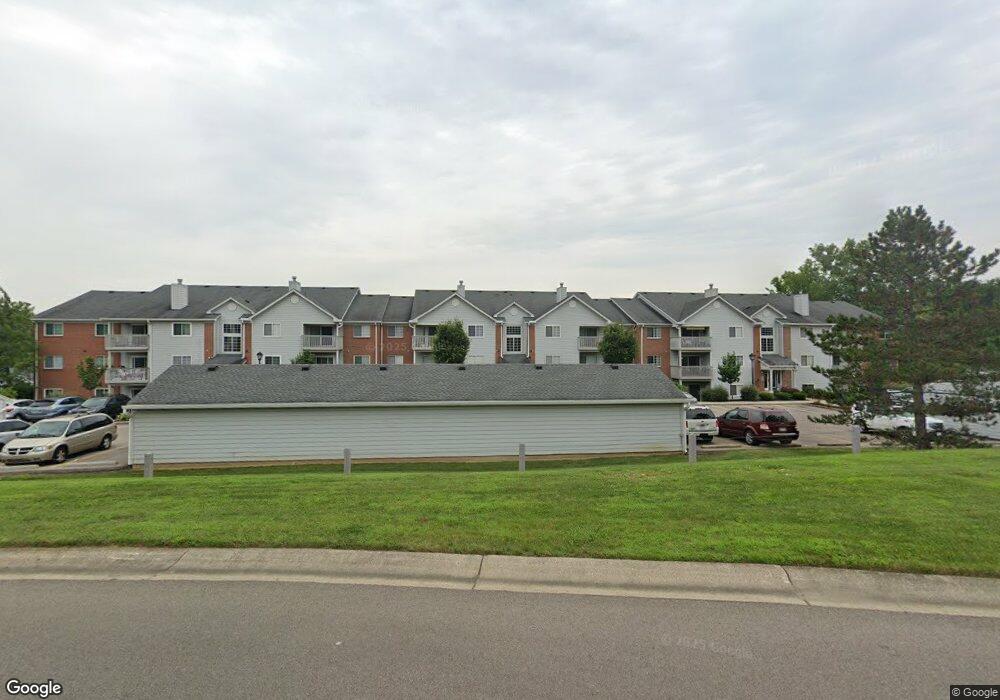
7746 Scioto Ct West Chester, OH 45069
West Chester Township NeighborhoodEstimated Value: $192,038 - $200,000
2
Beds
2
Baths
1,144
Sq Ft
$171/Sq Ft
Est. Value
About This Home
This home is located at 7746 Scioto Ct, West Chester, OH 45069 and is currently estimated at $195,510, approximately $170 per square foot. 7746 Scioto Ct is a home located in Butler County with nearby schools including Union Elementary School, Hopewell Early Childhood School, and Hopewell Junior School.
Ownership History
Date
Name
Owned For
Owner Type
Purchase Details
Closed on
Apr 28, 2009
Sold by
Kamerer Megan and Kamerer Alex
Bought by
Fagin Whitney D and Fagin Josh
Current Estimated Value
Home Financials for this Owner
Home Financials are based on the most recent Mortgage that was taken out on this home.
Original Mortgage
$83,435
Outstanding Balance
$52,659
Interest Rate
4.83%
Mortgage Type
FHA
Estimated Equity
$142,851
Purchase Details
Closed on
May 31, 2000
Sold by
Mason Eric G and Mason Stephanie
Bought by
Overman Kelly L and Burghard Joe D
Home Financials for this Owner
Home Financials are based on the most recent Mortgage that was taken out on this home.
Original Mortgage
$77,500
Interest Rate
8.62%
Purchase Details
Closed on
Nov 2, 1995
Sold by
Hills Building & Const S
Bought by
Mason Eric G and Harris Stephanie D
Home Financials for this Owner
Home Financials are based on the most recent Mortgage that was taken out on this home.
Original Mortgage
$66,600
Interest Rate
7.61%
Mortgage Type
FHA
Create a Home Valuation Report for This Property
The Home Valuation Report is an in-depth analysis detailing your home's value as well as a comparison with similar homes in the area
Home Values in the Area
Average Home Value in this Area
Purchase History
| Date | Buyer | Sale Price | Title Company |
|---|---|---|---|
| Fagin Whitney D | $85,000 | Ltoc | |
| Overman Kelly L | $77,500 | -- | |
| Mason Eric G | $72,095 | -- |
Source: Public Records
Mortgage History
| Date | Status | Borrower | Loan Amount |
|---|---|---|---|
| Open | Fagin Whitney D | $83,435 | |
| Previous Owner | Overman Kelly L | $77,500 | |
| Previous Owner | Mason Eric G | $66,600 |
Source: Public Records
Tax History Compared to Growth
Tax History
| Year | Tax Paid | Tax Assessment Tax Assessment Total Assessment is a certain percentage of the fair market value that is determined by local assessors to be the total taxable value of land and additions on the property. | Land | Improvement |
|---|---|---|---|---|
| 2024 | $2,239 | $53,410 | $4,900 | $48,510 |
| 2023 | $2,196 | $53,410 | $4,900 | $48,510 |
| 2022 | $2,019 | $35,920 | $4,900 | $31,020 |
| 2021 | $1,825 | $34,450 | $4,900 | $29,550 |
| 2020 | $1,868 | $34,450 | $4,900 | $29,550 |
| 2019 | $2,542 | $26,530 | $4,900 | $21,630 |
| 2018 | $1,511 | $26,530 | $4,900 | $21,630 |
| 2017 | $1,538 | $26,530 | $4,900 | $21,630 |
| 2016 | $1,569 | $25,500 | $4,900 | $20,600 |
| 2015 | $1,559 | $25,500 | $4,900 | $20,600 |
| 2014 | $1,657 | $25,500 | $4,900 | $20,600 |
| 2013 | $1,657 | $26,210 | $6,300 | $19,910 |
Source: Public Records
Map
Nearby Homes
- 7746 Scioto Ct
- 7636 Shawnee Ln
- 7636 Shawnee Ln Unit 206
- 7560 Shawnee Ln
- 7619 Brookstone Dr
- 7974 Thistlewood Dr
- 6570 Glen Arbor Dr
- 7724 W Lake Dr
- 7913 Merryman Way
- 6387 Coachlight Way
- 7947 Kennesaw Dr
- 7228 Shady Hollow Ln
- 7420 Kennesaw Dr
- 8062 Kennesaw Dr
- 8199 Vadith Ct
- 7534 Galway Ct
- 6210 Cardington Place
- 7436 Wetherington Dr
- 8164 Foxdale Ct
- 7948 Bayer Dr
- 7746 Scioto Ct Unit 320
- 7746 Scioto Ct
- 7746 Scioto Ct
- 7746 Scioto Ct
- 7746 Scioto Ct
- 7746 Scioto Ct
- 7746 Scioto Ct
- 7746 Scioto Ct
- 7746 Scioto Ct
- 7746 Scioto Ct
- 7746 Scioto Ct
- 7746 Scioto Ct Unit 215
- 7746 Scioto Ct Unit 317
- 7746 Scioto Ct Unit 318
- 7746 Scioto Ct Unit 214
- 7746 Scioto Ct Unit 111
- 7746 Scioto Ct Unit 319
- 7736 Scioto Ct Unit 315
- 7736 Scioto Ct
- 7736 Scioto Ct