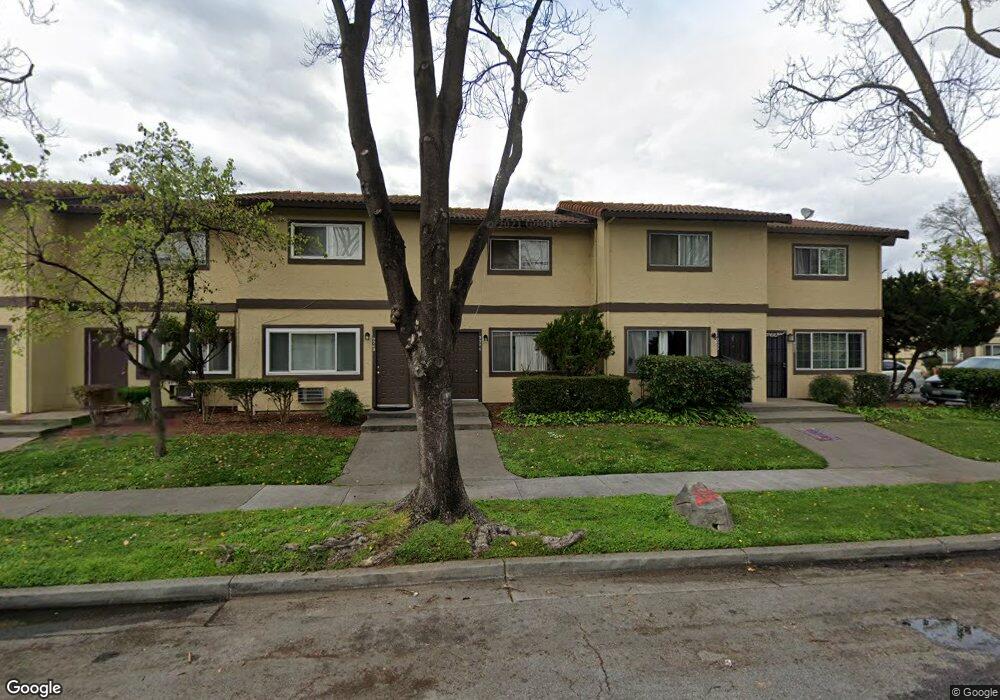
7763 Chestnut St Gilroy, CA 95020
Estimated Value: $408,000 - $681,000
2
Beds
2
Baths
908
Sq Ft
$546/Sq Ft
Est. Value
About This Home
This home is located at 7763 Chestnut St, Gilroy, CA 95020 and is currently estimated at $496,058, approximately $546 per square foot. 7763 Chestnut St is a home located in Santa Clara County with nearby schools including Eliot Elementary School, South Valley Middle School, and Brownell Middle School.
Ownership History
Date
Name
Owned For
Owner Type
Purchase Details
Closed on
Jan 25, 2011
Sold by
Mortgage It Inc
Bought by
Li Jiansheng and Huang Qi Bao
Current Estimated Value
Purchase Details
Closed on
Nov 5, 2010
Sold by
Solis Glenda and Solis Antonio
Bought by
Mortgage It Inc
Purchase Details
Closed on
Dec 28, 2005
Sold by
Ledesma Beatrice A
Bought by
Solis Antonio and Solis Glenda
Home Financials for this Owner
Home Financials are based on the most recent Mortgage that was taken out on this home.
Original Mortgage
$68,800
Interest Rate
6.25%
Mortgage Type
Credit Line Revolving
Purchase Details
Closed on
Jun 1, 1998
Sold by
Adams Carroll W and Adams Elfriede E
Bought by
Ledesma Beatrice A
Create a Home Valuation Report for This Property
The Home Valuation Report is an in-depth analysis detailing your home's value as well as a comparison with similar homes in the area
Home Values in the Area
Average Home Value in this Area
Purchase History
| Date | Buyer | Sale Price | Title Company |
|---|---|---|---|
| Li Jiansheng | $113,500 | Fidelity Natl Title Co Of Ca | |
| Mortgage It Inc | $100,800 | Accommodation | |
| Solis Antonio | $344,000 | Alliance Title Company | |
| Ledesma Beatrice A | $75,000 | Chicago Title Co |
Source: Public Records
Mortgage History
| Date | Status | Borrower | Loan Amount |
|---|---|---|---|
| Previous Owner | Solis Antonio | $68,800 | |
| Previous Owner | Solis Antonio | $275,200 |
Source: Public Records
Tax History Compared to Growth
Tax History
| Year | Tax Paid | Tax Assessment Tax Assessment Total Assessment is a certain percentage of the fair market value that is determined by local assessors to be the total taxable value of land and additions on the property. | Land | Improvement |
|---|---|---|---|---|
| 2025 | $1,839 | $145,400 | $72,700 | $72,700 |
| 2024 | $1,839 | $142,550 | $71,275 | $71,275 |
| 2023 | $1,828 | $139,756 | $69,878 | $69,878 |
| 2022 | $1,798 | $137,016 | $68,508 | $68,508 |
| 2021 | $1,789 | $134,330 | $67,165 | $67,165 |
| 2020 | $1,770 | $132,954 | $66,477 | $66,477 |
| 2019 | $1,754 | $130,348 | $65,174 | $65,174 |
| 2018 | $1,641 | $127,794 | $63,897 | $63,897 |
| 2017 | $1,674 | $125,290 | $62,645 | $62,645 |
| 2016 | $1,632 | $122,834 | $61,417 | $61,417 |
| 2015 | $1,542 | $120,990 | $60,495 | $60,495 |
| 2014 | $1,532 | $118,620 | $59,310 | $59,310 |
Source: Public Records
Map
Nearby Homes
- 7743 Chestnut St
- 332 Lewis St Unit 1/2
- 332 Lewis St
- 7759 Murray Ave
- 7621 Forest St
- 7521 Chestnut St
- 188 Caroline Ln
- 160 Sarafina Way
- 0 Monterey Rd
- 7711 Monterey St
- 194 4th St
- 8282 Murray Ave Unit 99
- 8282 Murray Ave Unit 76
- 7691 Church St Unit B
- 8180 Forest St
- 286 5th St
- 8282 Murray #90 Ave Unit 90
- 7630 Hanna St
- 7191 Eigleberry St
- 8340 Forest St
- 7761 Chestnut St
- 7771 Chestnut St Unit 42
- 7753 Chestnut St
- 7773 Chestnut St Unit 43
- 7781 Chestnut St
- 7751 Chestnut St Unit 38
- 7729 Murray Ave
- 7775 Ghirlanda Ct
- 7727 Murray Ave
- 7765 Ghirlanda Ct
- 7767 Ghirlanda Ct
- 7757 Ghirlanda Ct
- 7777 Ghirlanda Ct
- 7785 Ghirlanda Ct
- 7741 Chestnut St
- 7725 Murray Ave
- 7778 Chestnut St
- 7766 Chestnut St
- 7780 Chestnut St
- 7733 Chestnut St