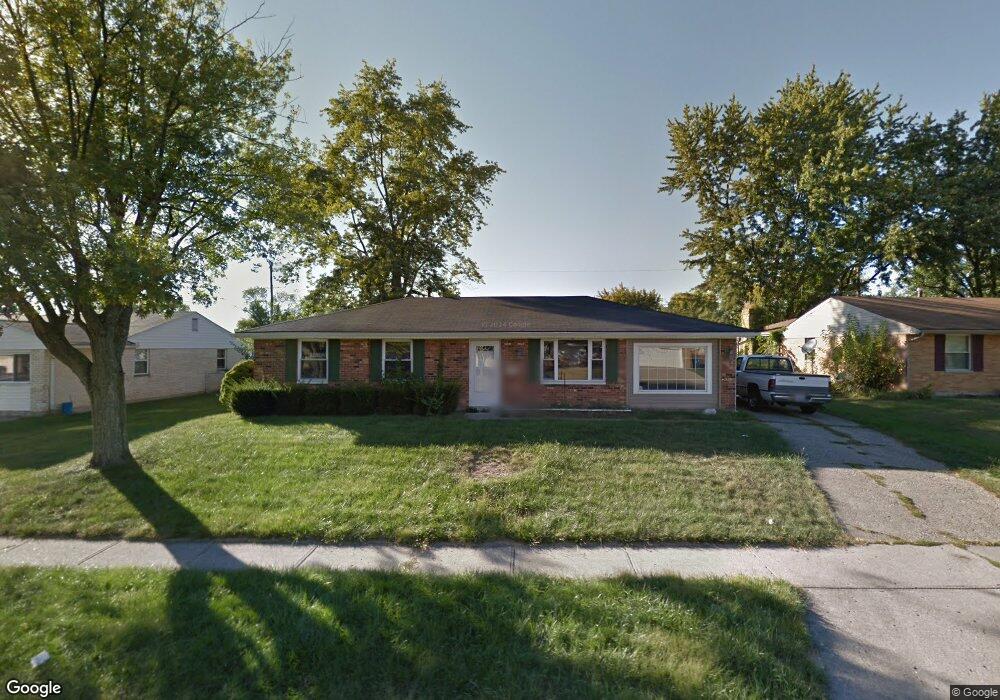
7779 Redbank Ln Dayton, OH 45424
Estimated Value: $198,801 - $228,000
3
Beds
2
Baths
1,350
Sq Ft
$156/Sq Ft
Est. Value
About This Home
This home is located at 7779 Redbank Ln, Dayton, OH 45424 and is currently estimated at $210,450, approximately $155 per square foot. 7779 Redbank Ln is a home located in Montgomery County with nearby schools including Wayne High School and Huber Heights Christian Academy.
Ownership History
Date
Name
Owned For
Owner Type
Purchase Details
Closed on
Jul 19, 2019
Sold by
Ogletree Bryan C and Ogletree Amy E
Bought by
Pierson Julie Anne
Current Estimated Value
Home Financials for this Owner
Home Financials are based on the most recent Mortgage that was taken out on this home.
Original Mortgage
$117,826
Outstanding Balance
$104,120
Interest Rate
4.25%
Mortgage Type
FHA
Estimated Equity
$106,330
Purchase Details
Closed on
Feb 21, 2014
Sold by
Fannie Mae
Bought by
Ogletree Bryan C
Home Financials for this Owner
Home Financials are based on the most recent Mortgage that was taken out on this home.
Original Mortgage
$60,000
Interest Rate
4.35%
Mortgage Type
Future Advance Clause Open End Mortgage
Purchase Details
Closed on
Sep 19, 2013
Sold by
Brown Richard T and Citi Mortgage Inc
Bought by
Federal National Mortgage Association
Purchase Details
Closed on
Jul 5, 1994
Sold by
Wright Malcolm D and Wright Nancy A
Bought by
Brown Richard T and Brown Charlotte A
Create a Home Valuation Report for This Property
The Home Valuation Report is an in-depth analysis detailing your home's value as well as a comparison with similar homes in the area
Home Values in the Area
Average Home Value in this Area
Purchase History
| Date | Buyer | Sale Price | Title Company |
|---|---|---|---|
| Pierson Julie Anne | $120,000 | Sterling & Title Agency Inc | |
| Ogletree Bryan C | -- | Nova Title Agency Inc | |
| Federal National Mortgage Association | $50,000 | None Available | |
| Brown Richard T | -- | -- |
Source: Public Records
Mortgage History
| Date | Status | Borrower | Loan Amount |
|---|---|---|---|
| Open | Pierson Julie Anne | $117,826 | |
| Previous Owner | Ogletree Bryan C | $60,000 |
Source: Public Records
Tax History Compared to Growth
Tax History
| Year | Tax Paid | Tax Assessment Tax Assessment Total Assessment is a certain percentage of the fair market value that is determined by local assessors to be the total taxable value of land and additions on the property. | Land | Improvement |
|---|---|---|---|---|
| 2024 | $2,804 | $52,990 | $10,150 | $42,840 |
| 2023 | $2,804 | $52,990 | $10,150 | $42,840 |
| 2022 | $2,450 | $36,510 | $7,000 | $29,510 |
| 2021 | $2,487 | $36,510 | $7,000 | $29,510 |
| 2020 | $2,489 | $36,510 | $7,000 | $29,510 |
| 2019 | $1,964 | $25,340 | $7,000 | $18,340 |
| 2018 | $1,971 | $25,340 | $7,000 | $18,340 |
| 2017 | $1,959 | $25,340 | $7,000 | $18,340 |
| 2016 | $2,045 | $25,820 | $7,000 | $18,820 |
| 2015 | $2,020 | $25,820 | $7,000 | $18,820 |
| 2014 | $2,020 | $25,820 | $7,000 | $18,820 |
| 2012 | -- | $29,100 | $8,750 | $20,350 |
Source: Public Records
Map
Nearby Homes
- 7866 Harshmanville Rd
- 7854 Harshmanville Rd
- 7833 Harshmanville Rd
- 6681 Spokane Dr
- 6701 Springport Way
- 6447 Highbury Rd
- 7371 Damascus Dr
- 6605 Highbury Rd
- 8282 Briar Ridge Ct
- 6150 Taylorsville Rd
- 7741 Shalamar Dr
- 7150 Harshmanville Rd
- 6601 Grovehill Dr
- 7660 Stonecrest Dr
- 7611 Shepherdess Dr
- 6089 Green Knolls Dr
- 6811 Highbury Rd
- 6219 Beacon Tree Ct
- 6245 Longford Rd
- 6334 Shull Rd
- 7771 Redbank Ln
- 7785 Redbank Ln
- 7746 Bassett Dr
- 7752 Bassett Dr
- 7765 Redbank Ln
- 7791 Redbank Ln
- 7740 Bassett Dr
- 7780 Redbank Ln
- 7758 Bassett Dr
- 7786 Redbank Ln
- 7766 Redbank Ln
- 7734 Bassett Dr
- 7757 Redbank Ln
- 7797 Redbank Ln
- 7764 Bassett Dr
- 7800 Redbank Ln
- 7760 Redbank Ln
- 7749 Bassett Dr
- 7711 Remmick Ln
- 7701 Remmick Ln