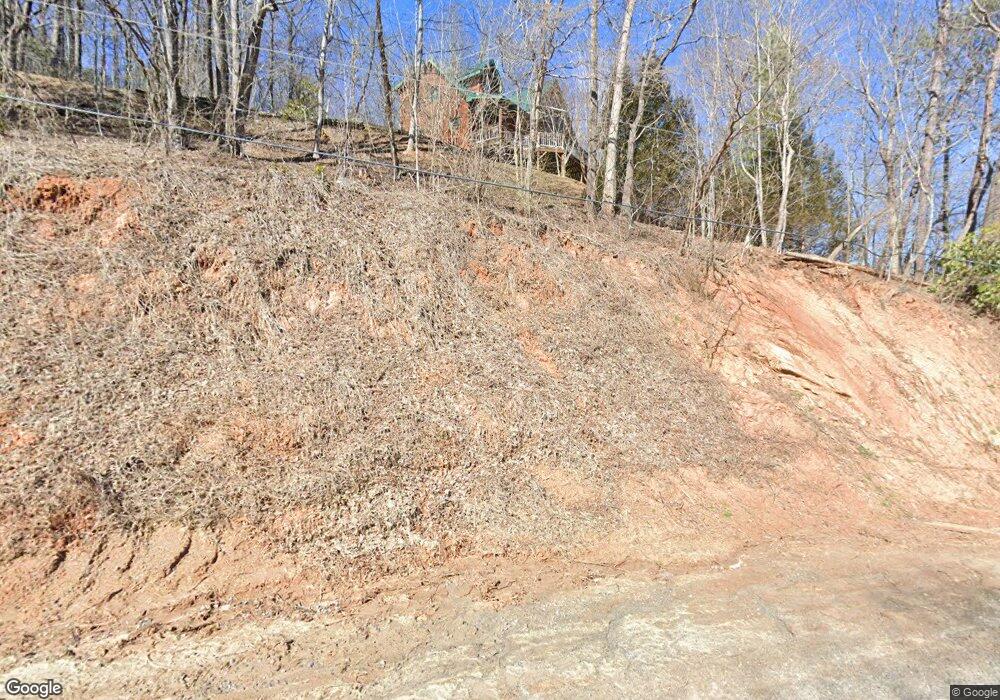
78 Hobson Dr Old Fort, NC 28762
Estimated Value: $526,000 - $716,000
3
Beds
2
Baths
1,756
Sq Ft
$356/Sq Ft
Est. Value
About This Home
This home is located at 78 Hobson Dr, Old Fort, NC 28762 and is currently estimated at $625,621, approximately $356 per square foot. 78 Hobson Dr is a home located in McDowell County with nearby schools including Old Fort Elementary School, West McDowell Junior High School, and McDowell High School.
Ownership History
Date
Name
Owned For
Owner Type
Purchase Details
Closed on
Jun 7, 2017
Sold by
Mckinny Ryan and Mckinny Tonya
Bought by
78 Hobson Drive Trust
Current Estimated Value
Purchase Details
Closed on
Mar 31, 2017
Sold by
Maple Ridge Cabin Llc
Bought by
Mckinny Ryan and Mckinny Tonya
Home Financials for this Owner
Home Financials are based on the most recent Mortgage that was taken out on this home.
Original Mortgage
$316,800
Outstanding Balance
$262,561
Interest Rate
4.15%
Mortgage Type
New Conventional
Estimated Equity
$363,060
Purchase Details
Closed on
Mar 18, 2009
Sold by
Bogumil Walter A and Bogumil Natalie M
Bought by
Maple Ridge Cabin Llc
Purchase Details
Closed on
Feb 19, 2008
Sold by
Bogumil Walter A and Bogumil Natallie M
Bought by
Maple Ridge Cabin Llc
Purchase Details
Closed on
Feb 17, 2005
Sold by
Mill Creek Ridge Corporation
Bought by
Bogumil Walter A and Bogumil Natallie M
Create a Home Valuation Report for This Property
The Home Valuation Report is an in-depth analysis detailing your home's value as well as a comparison with similar homes in the area
Home Values in the Area
Average Home Value in this Area
Purchase History
| Date | Buyer | Sale Price | Title Company |
|---|---|---|---|
| 78 Hobson Drive Trust | -- | None Available | |
| Mckinny Ryan | $352,000 | None Available | |
| Maple Ridge Cabin Llc | -- | None Available | |
| Maple Ridge Cabin Llc | -- | None Available | |
| Bogumil Walter A | $17,000 | None Available |
Source: Public Records
Mortgage History
| Date | Status | Borrower | Loan Amount |
|---|---|---|---|
| Open | Mckinny Ryan | $316,800 |
Source: Public Records
Tax History Compared to Growth
Tax History
| Year | Tax Paid | Tax Assessment Tax Assessment Total Assessment is a certain percentage of the fair market value that is determined by local assessors to be the total taxable value of land and additions on the property. | Land | Improvement |
|---|---|---|---|---|
| 2025 | $3,746 | $529,040 | $43,800 | $485,240 |
| 2024 | $3,746 | $529,040 | $43,800 | $485,240 |
| 2023 | $3,640 | $529,040 | $43,800 | $485,240 |
| 2022 | $2,663 | $381,540 | $36,500 | $345,040 |
| 2021 | $2,663 | $381,540 | $36,500 | $345,040 |
| 2020 | $2,701 | $381,540 | $0 | $0 |
| 2019 | $2,701 | $194,780 | $0 | $0 |
| 2017 | $1,248 | $194,780 | $0 | $0 |
| 2016 | $1,248 | $194,780 | $25,550 | $169,230 |
| 2014 | $1,227 | $194,780 | $25,550 | $169,230 |
| 2013 | -- | $194,780 | $25,550 | $169,230 |
Source: Public Records
Map
Nearby Homes
- TBD Graphite Rd
- 26 Kitazuma Rd
- 1037 Newberry Creek Rd
- 345 Pine Brae Farm Dr
- 78 Tupper Rd
- 60 Meeks Rd
- 99999 Yates Ave
- 22 Moore Cir
- 212 Yates Ave
- 9999 Yates Ave Unit PT A
- 328 Texas Rd
- 105 Bartram Way
- 107 Bartram Way
- 32 Tucker Rd
- 6 Beech St
- 304 Georgia Terrace
- 0000 Yates Ave
- 75 Craven Hill Cir
- 146 Center St Unit 9 & 10
- 0000 Lookout Terrace Rd
- 77 Mill Creek Ridge Rd
- 80 Mill Creek Rd Unit 8
- 146 Hobson Dr
- 146 Hobson Dr Unit 1
- 1 acre Hobson Dr Unit 2
- 2345 Mill Creek Rd
- 2340 Mill Creek Rd
- xxx Hobson Dr Unit 5
- xxx Hobson Dr Unit 2
- 56 Graphite Rd
- 86 Paris Creek Rd
- 2108 Mill Creek Rd
- 0 Tbd Mill Creek Rd Unit 3912291
- TBD Mill Creek Rd
- 00 Mill Creek Rd
- 9999 Mill Creek Rd