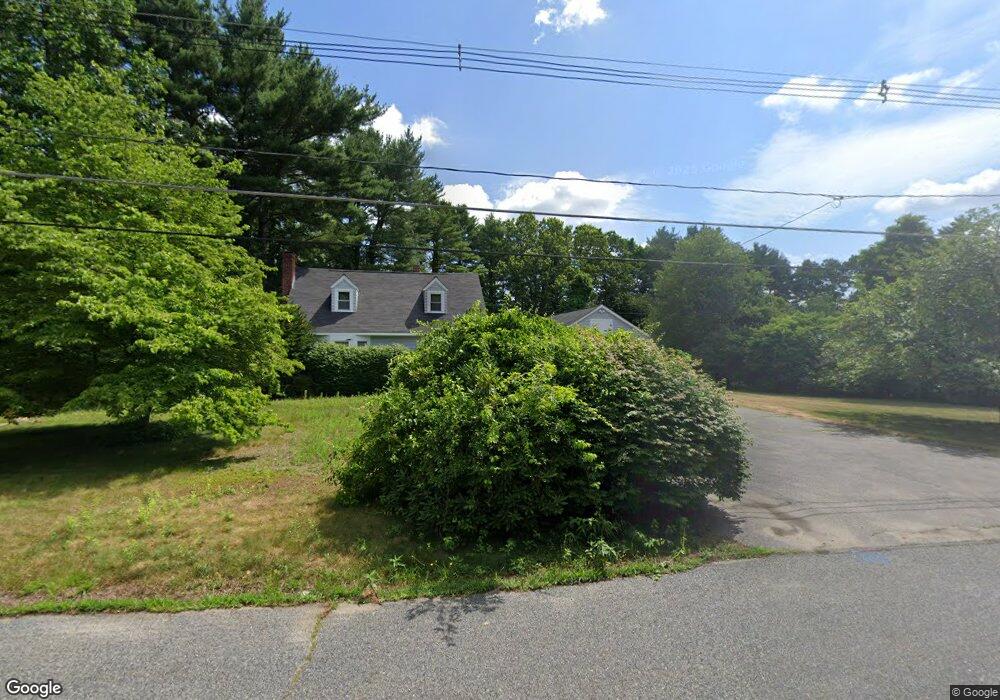
78 N High St Foxboro, MA 02035
Estimated Value: $548,000 - $664,000
2
Beds
3
Baths
1,638
Sq Ft
$382/Sq Ft
Est. Value
About This Home
This home is located at 78 N High St, Foxboro, MA 02035 and is currently estimated at $625,612, approximately $381 per square foot. 78 N High St is a home located in Norfolk County with nearby schools including Foxborough High School, Foxborough Regional Charter School, and Hands-On-Montessori School.
Ownership History
Date
Name
Owned For
Owner Type
Purchase Details
Closed on
Mar 16, 1999
Sold by
Waseleski Jay W
Bought by
Waseleski Joseph V
Current Estimated Value
Home Financials for this Owner
Home Financials are based on the most recent Mortgage that was taken out on this home.
Original Mortgage
$147,000
Interest Rate
6.73%
Mortgage Type
Purchase Money Mortgage
Create a Home Valuation Report for This Property
The Home Valuation Report is an in-depth analysis detailing your home's value as well as a comparison with similar homes in the area
Home Values in the Area
Average Home Value in this Area
Purchase History
| Date | Buyer | Sale Price | Title Company |
|---|---|---|---|
| Waseleski Joseph V | $184,000 | -- |
Source: Public Records
Mortgage History
| Date | Status | Borrower | Loan Amount |
|---|---|---|---|
| Open | Waseleski Joseph V | $156,000 | |
| Closed | Waseleski Joseph V | $147,000 | |
| Previous Owner | Waseleski Joseph V | $147,200 |
Source: Public Records
Tax History Compared to Growth
Tax History
| Year | Tax Paid | Tax Assessment Tax Assessment Total Assessment is a certain percentage of the fair market value that is determined by local assessors to be the total taxable value of land and additions on the property. | Land | Improvement |
|---|---|---|---|---|
| 2025 | $6,548 | $495,300 | $245,900 | $249,400 |
| 2024 | $6,266 | $463,800 | $245,900 | $217,900 |
| 2023 | $6,143 | $432,300 | $234,200 | $198,100 |
| 2022 | $6,344 | $436,900 | $224,000 | $212,900 |
| 2021 | $5,971 | $405,100 | $203,700 | $201,400 |
| 2020 | $5,783 | $396,900 | $203,700 | $193,200 |
| 2019 | $5,501 | $374,200 | $194,000 | $180,200 |
| 2018 | $5,404 | $370,900 | $194,000 | $176,900 |
| 2017 | $5,091 | $338,500 | $181,300 | $157,200 |
| 2016 | $5,294 | $357,200 | $174,600 | $182,600 |
| 2015 | $5,013 | $330,000 | $147,400 | $182,600 |
| 2014 | $4,896 | $326,600 | $144,500 | $182,100 |
Source: Public Records
Map
Nearby Homes
- 356 Central St
- 12 Spring St
- 277 Central St
- 450 West St
- 166 Chauncy St
- 11 W Belcher Rd Unit 2
- 80 Mill St
- 28 Angell St
- 44 Angell St Unit 44
- 406 South St
- 619 N Main St
- 18 Winter St Unit E
- 14 Winter St Unit B
- 84 Cocasset St Unit A6
- 22 Pleasant St Unit C
- 24 Mechanic St
- 14 Baker St
- 82 Brook St
- 11 Orchard Place Unit 11
- 28 Court St