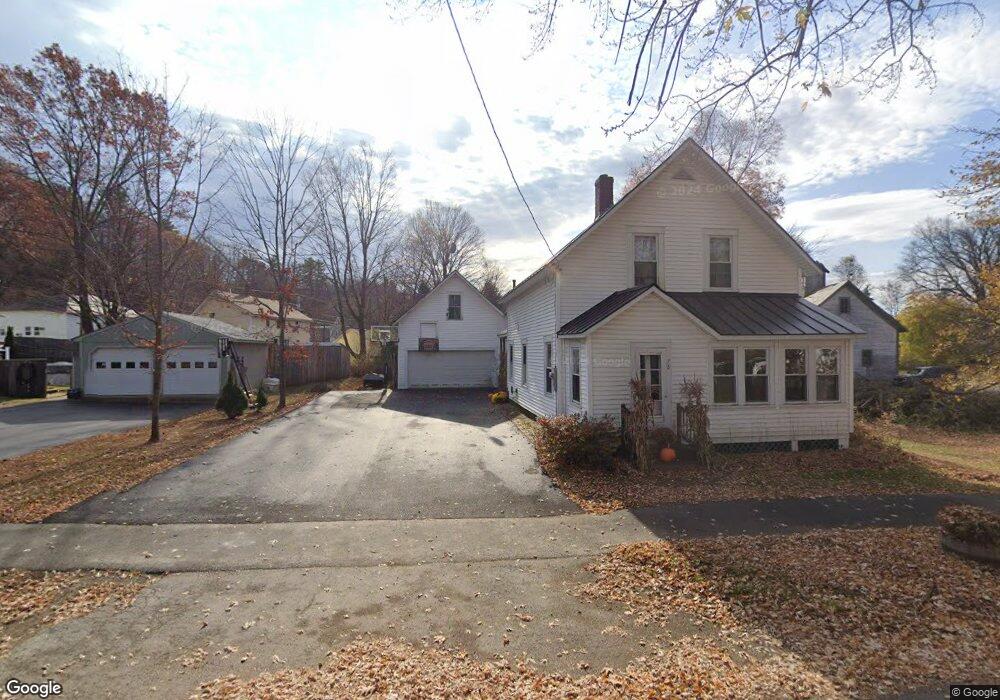
78 Summer St Charlestown, NH 03603
Estimated Value: $251,000 - $323,000
3
Beds
2
Baths
1,989
Sq Ft
$149/Sq Ft
Est. Value
About This Home
This home is located at 78 Summer St, Charlestown, NH 03603 and is currently estimated at $295,534, approximately $148 per square foot. 78 Summer St is a home located in Sullivan County with nearby schools including Charlestown Primary School, Charlestown Middle School, and Fall Mountain Regional High School.
Ownership History
Date
Name
Owned For
Owner Type
Purchase Details
Closed on
Feb 23, 2017
Sold by
Marquay Jennifer M
Bought by
Marquay Jennifer M and Marquay Joseph M
Current Estimated Value
Purchase Details
Closed on
Aug 15, 2005
Sold by
Dexter William R and Dexter Susan P
Bought by
Kelcey Robert D and Kelcey Jennifer M
Home Financials for this Owner
Home Financials are based on the most recent Mortgage that was taken out on this home.
Original Mortgage
$85,000
Interest Rate
5.54%
Mortgage Type
Purchase Money Mortgage
Create a Home Valuation Report for This Property
The Home Valuation Report is an in-depth analysis detailing your home's value as well as a comparison with similar homes in the area
Home Values in the Area
Average Home Value in this Area
Purchase History
| Date | Buyer | Sale Price | Title Company |
|---|---|---|---|
| Marquay Jennifer M | -- | -- | |
| Kelcey Robert D | $85,000 | -- |
Source: Public Records
Mortgage History
| Date | Status | Borrower | Loan Amount |
|---|---|---|---|
| Previous Owner | Kelcey Robert D | $78,900 | |
| Previous Owner | Kelcey Robert D | $85,000 |
Source: Public Records
Tax History Compared to Growth
Tax History
| Year | Tax Paid | Tax Assessment Tax Assessment Total Assessment is a certain percentage of the fair market value that is determined by local assessors to be the total taxable value of land and additions on the property. | Land | Improvement |
|---|---|---|---|---|
| 2024 | $5,429 | $149,300 | $29,500 | $119,800 |
| 2023 | $5,122 | $149,300 | $29,500 | $119,800 |
| 2022 | $4,818 | $149,300 | $29,500 | $119,800 |
| 2021 | $4,719 | $149,300 | $29,500 | $119,800 |
| 2020 | $5,484 | $141,900 | $30,000 | $111,900 |
| 2019 | $5,550 | $141,900 | $30,000 | $111,900 |
| 2017 | $5,179 | $141,900 | $30,000 | $111,900 |
| 2016 | $4,974 | $141,900 | $30,000 | $111,900 |
| 2015 | $4,864 | $151,100 | $24,800 | $126,300 |
| 2014 | $4,758 | $151,100 | $24,800 | $126,300 |
| 2013 | $4,878 | $151,100 | $24,800 | $126,300 |
Source: Public Records
Map
Nearby Homes
- 29 River St
- 38 Railroad St
- 69 Stevens Rd
- 71 River St
- 2 Lower Landing Park
- 10 Riverfront Dr
- 63 Riverview Dr
- 11 Bracket Cir
- 2 Crown Point Dr Unit A
- 20 Ponderosa Park
- 476 Missing Link Rd
- 0 Norman Ave Unit 6
- 0 Claremont Rd Unit 6
- 281 Connecticut Heights Rd
- 123 Hepatica Ln
- 52 Morways Park
- 41 Morways Park
- 25 Morways Park
- 1010 Morways Park
- 1025 Mountainview Ave