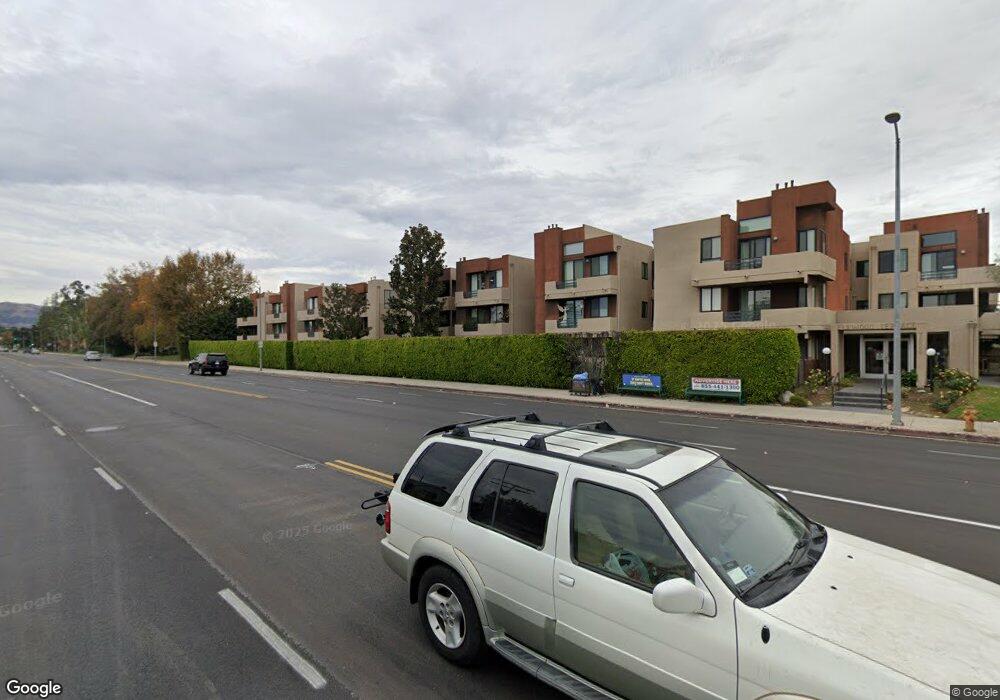
7826 Topanga Cyn Blvd Unit 319 Canoga Park, CA 91304
Canoga Park NeighborhoodEstimated Value: $419,105 - $447,000
2
Beds
2
Baths
905
Sq Ft
$484/Sq Ft
Est. Value
About This Home
This home is located at 7826 Topanga Cyn Blvd Unit 319, Canoga Park, CA 91304 and is currently estimated at $438,026, approximately $484 per square foot. 7826 Topanga Cyn Blvd Unit 319 is a home located in Los Angeles County with nearby schools including Canoga Park Elementary School, Christopher Columbus Middle School, and Canoga Park Senior High School.
Ownership History
Date
Name
Owned For
Owner Type
Purchase Details
Closed on
Feb 17, 2016
Sold by
Minassian Mary
Bought by
Minassian Trust
Current Estimated Value
Purchase Details
Closed on
Jul 14, 2014
Sold by
Minassian George
Bought by
Minassian Mary
Purchase Details
Closed on
Nov 19, 2013
Sold by
Minassian George
Bought by
Minassian George and Minassian Mary
Purchase Details
Closed on
Apr 7, 2011
Sold by
Mokhatas Peter
Bought by
Minassian George and Minassian Mary
Home Financials for this Owner
Home Financials are based on the most recent Mortgage that was taken out on this home.
Original Mortgage
$104,800
Outstanding Balance
$72,404
Interest Rate
4.83%
Mortgage Type
New Conventional
Estimated Equity
$365,622
Purchase Details
Closed on
Jul 28, 2005
Sold by
Elkwood Terrace Assoc Lp
Bought by
Mokhatas Peter
Home Financials for this Owner
Home Financials are based on the most recent Mortgage that was taken out on this home.
Original Mortgage
$256,000
Interest Rate
1%
Mortgage Type
Negative Amortization
Create a Home Valuation Report for This Property
The Home Valuation Report is an in-depth analysis detailing your home's value as well as a comparison with similar homes in the area
Home Values in the Area
Average Home Value in this Area
Purchase History
| Date | Buyer | Sale Price | Title Company |
|---|---|---|---|
| Minassian Trust | -- | None Available | |
| Minassian Mary | -- | None Available | |
| Minassian George | -- | Accommodation | |
| Minassian Melina | -- | Accommodation | |
| Minassian George | $131,000 | Lawyers Title | |
| Mokhatas Peter | $320,000 | Stewart Title Company |
Source: Public Records
Mortgage History
| Date | Status | Borrower | Loan Amount |
|---|---|---|---|
| Open | Minassian George | $104,800 | |
| Previous Owner | Mokhatas Peter | $256,000 |
Source: Public Records
Tax History Compared to Growth
Tax History
| Year | Tax Paid | Tax Assessment Tax Assessment Total Assessment is a certain percentage of the fair market value that is determined by local assessors to be the total taxable value of land and additions on the property. | Land | Improvement |
|---|---|---|---|---|
| 2025 | $2,120 | $167,820 | $50,088 | $117,732 |
| 2024 | $2,120 | $164,530 | $49,106 | $115,424 |
| 2023 | $2,081 | $161,305 | $48,144 | $113,161 |
| 2022 | $1,985 | $158,143 | $47,200 | $110,943 |
| 2021 | $1,957 | $155,043 | $46,275 | $108,768 |
| 2019 | $1,899 | $150,446 | $44,903 | $105,543 |
| 2018 | $1,880 | $147,497 | $44,023 | $103,474 |
| 2016 | $1,788 | $141,771 | $42,314 | $99,457 |
| 2015 | $1,763 | $139,643 | $41,679 | $97,964 |
| 2014 | $1,776 | $136,909 | $40,863 | $96,046 |
Source: Public Records
Map
Nearby Homes
- 7826 Topanga Canyon Blvd Unit 218
- 7826 Topanga Canyon Blvd Unit 301
- 7826 Topanga Canyon Blvd Unit 231
- 7826 Topanga Unit 213
- 7800 Topanga Canyon Blvd Unit 208
- 7934 Vassar Ave
- 7650 Topanga Canyon Blvd Unit 14
- 7845 Nevada Ave
- 22151 Ingomar St
- 7725 Owensmouth Ave
- 22158 Elkwood St
- 7716 Owensmouth Ave
- 7605 Jordan Ave Unit 6
- 22020 Saticoy St
- 7551 Jordan Ave Unit 405
- 7551 Jordan Ave Unit 109
- 22128 Burton St
- 7519 Owensmouth Ave
- 7749 Nita Ave
- 7816 Shoup Ave
- 7826 Topanga Cyn Blvd Unit 305
- 7826 Topanga Cyn Blvd Unit 309
- 7826 Topanga Cyn Blvd Unit 313
- 7826 Topanga Cyn Blvd Unit 216
- 7826 Topanga Cyn Blvd Unit 320
- 7826 Topanga Cyn Blvd Unit 325
- 7826 Topanga Cyn Blvd Unit 302
- 7826 Topanga Cyn Blvd Unit 322
- 7826 Topanga Cyn Blvd Unit 222
- 7826 Topanga Cyn Blvd Unit 210
- 7826 Topanga Cyn Blvd Unit 113
- 7826 Topanga Canyon Blvd Unit 317
- 7826 Topanga Canyon Blvd Unit 110
- 7826 Topanga Canyon Blvd Unit 231 (51)
- 7826 Topanga Canyon Blvd Unit 324
- 7826 Topanga Canyon Blvd Unit 325
- 7826 Topanga Canyon Blvd Unit 305
- 7826 Topanga Canyon Blvd Unit 219
- 7826 Topanga Canyon Blvd Unit 209
- 7826 Topanga Canyon Blvd Unit 118