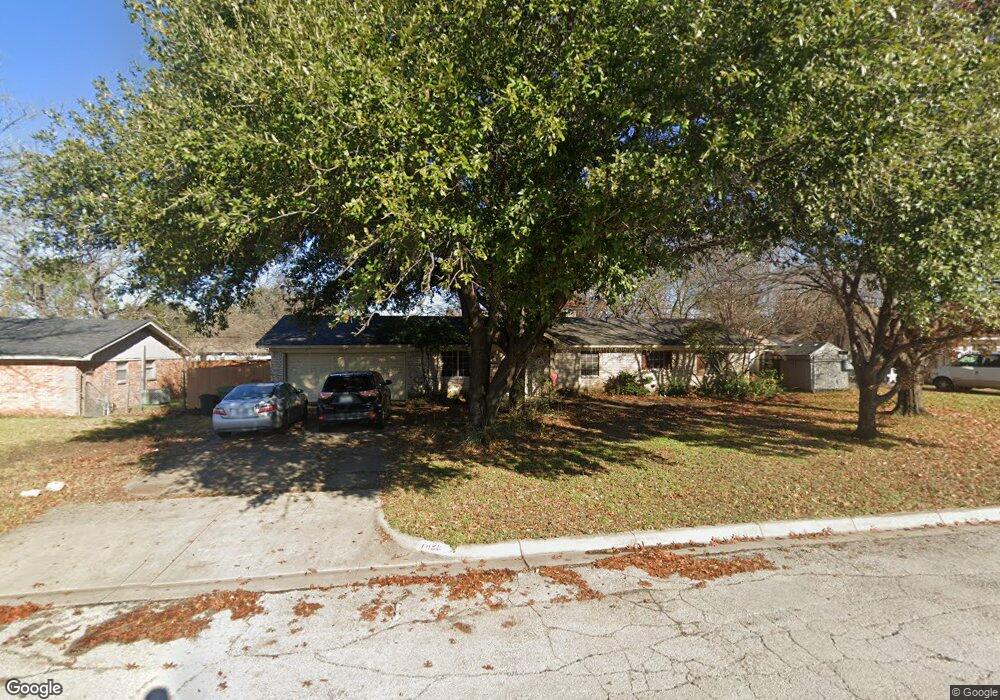
7829 Maplewood Ave North Richland Hills, TX 76180
Estimated Value: $280,000 - $301,000
4
Beds
2
Baths
1,644
Sq Ft
$177/Sq Ft
Est. Value
About This Home
This home is located at 7829 Maplewood Ave, North Richland Hills, TX 76180 and is currently estimated at $291,216, approximately $177 per square foot. 7829 Maplewood Ave is a home located in Tarrant County with nearby schools including Academy at C.F. Thomas Elementary, Richland Middle School, and Birdville High School.
Ownership History
Date
Name
Owned For
Owner Type
Purchase Details
Closed on
Sep 18, 2012
Sold by
Jmj Realty
Bought by
Hotchkiss Kristina
Current Estimated Value
Home Financials for this Owner
Home Financials are based on the most recent Mortgage that was taken out on this home.
Original Mortgage
$94,162
Outstanding Balance
$65,707
Interest Rate
3.75%
Mortgage Type
FHA
Estimated Equity
$225,509
Purchase Details
Closed on
May 1, 2012
Sold by
Giles Mark
Bought by
Jmj Realty
Purchase Details
Closed on
Aug 21, 2007
Sold by
Etkin Lowell and Etkin Judy
Bought by
Giles Mark
Home Financials for this Owner
Home Financials are based on the most recent Mortgage that was taken out on this home.
Original Mortgage
$117,731
Interest Rate
6.69%
Mortgage Type
Purchase Money Mortgage
Purchase Details
Closed on
May 28, 2002
Sold by
Boudreaux Robert D and Boudreaux Peggy L
Bought by
Etkin Lowell
Home Financials for this Owner
Home Financials are based on the most recent Mortgage that was taken out on this home.
Original Mortgage
$96,990
Interest Rate
6.92%
Create a Home Valuation Report for This Property
The Home Valuation Report is an in-depth analysis detailing your home's value as well as a comparison with similar homes in the area
Home Values in the Area
Average Home Value in this Area
Purchase History
| Date | Buyer | Sale Price | Title Company |
|---|---|---|---|
| Hotchkiss Kristina | -- | None Available | |
| Jmj Realty | $40,500 | None Available | |
| Giles Mark | -- | Rattikin Title | |
| Etkin Lowell | -- | Alamo Title Company |
Source: Public Records
Mortgage History
| Date | Status | Borrower | Loan Amount |
|---|---|---|---|
| Open | Hotchkiss Kristina | $94,162 | |
| Previous Owner | Giles Mark | $117,731 | |
| Previous Owner | Etkin Lowell | $96,990 |
Source: Public Records
Tax History Compared to Growth
Tax History
| Year | Tax Paid | Tax Assessment Tax Assessment Total Assessment is a certain percentage of the fair market value that is determined by local assessors to be the total taxable value of land and additions on the property. | Land | Improvement |
|---|---|---|---|---|
| 2025 | $5,703 | $262,796 | $45,000 | $217,796 |
| 2024 | $5,703 | $262,796 | $45,000 | $217,796 |
| 2023 | $4,856 | $221,373 | $45,000 | $176,373 |
| 2022 | $4,738 | $196,895 | $23,000 | $173,895 |
| 2021 | $5,377 | $211,322 | $23,000 | $188,322 |
| 2020 | $4,126 | $162,160 | $23,000 | $139,160 |
| 2019 | $4,270 | $162,160 | $23,000 | $139,160 |
| 2018 | $3,868 | $146,879 | $23,000 | $123,879 |
| 2017 | $4,006 | $148,892 | $23,000 | $125,892 |
| 2016 | $2,460 | $91,423 | $15,000 | $76,423 |
| 2015 | $2,300 | $85,600 | $15,000 | $70,600 |
| 2014 | $2,300 | $85,600 | $15,000 | $70,600 |
Source: Public Records
Map
Nearby Homes
- 5113 Bob Dr
- 8020 Laura St
- 5020 Colorado Blvd
- 7908 Lazy Lane Rd
- 5108 Nancy Ln
- 7717 Janetta Dr
- 5016 Wyoming Trail
- 4916 Susan Lee Ln
- 5304 Colorado Blvd
- 5024 Maryanna Way
- 5336 Davis Blvd
- 5117 Maryanna Way
- 5016 Winder Ct
- 5320 Topper Dr
- 7529 Susan Ct
- 7521 Susan Ct
- 8417 Emerald Cir
- Dalton II Plan at City Point
- Zoe Plan at City Point
- Hampton Plan at City Point
- 7825 Maplewood Ave
- 7833 Maplewood Ave
- 7828 Standley St
- 7832 Standley St
- 7824 Standley St
- 7836 Standley St
- 7828 Maplewood Ave
- 7837 Maplewood Ave
- 7821 Maplewood Ave
- 7824 Maplewood Ave
- 7832 Maplewood Ave
- 7820 Standley St
- 7840 Standley St
- 7820 Maplewood Ave
- 7836 Maplewood Ave
- 7816 Standley St
- 7817 Maplewood Ave
- 7829 Birchwood Dr
- 7825 Birchwood Dr
- 7816 Maplewood Ave