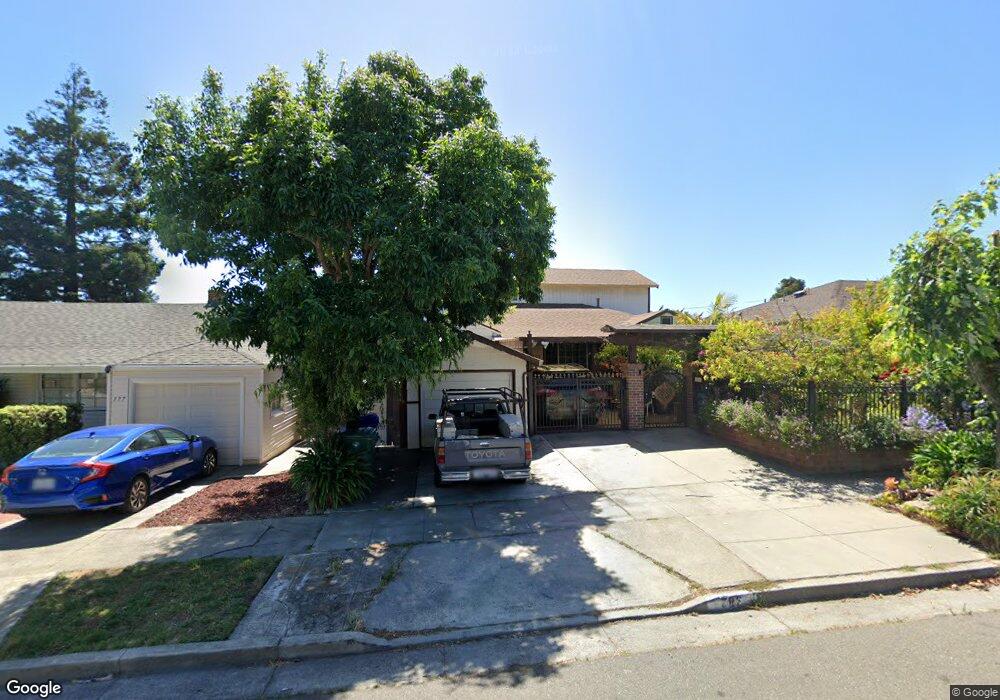
783 Kern St Richmond, CA 94805
East Richmond NeighborhoodEstimated Value: $725,876 - $854,000
4
Beds
2
Baths
1,892
Sq Ft
$406/Sq Ft
Est. Value
About This Home
This home is located at 783 Kern St, Richmond, CA 94805 and is currently estimated at $767,469, approximately $405 per square foot. 783 Kern St is a home located in Contra Costa County with nearby schools including Mira Vista Elementary School, Fred T. Korematsu Middle School, and El Cerrito Senior High School.
Ownership History
Date
Name
Owned For
Owner Type
Purchase Details
Closed on
Aug 21, 2025
Sold by
Nguyen Henry and Nguyen Linda
Bought by
Henry & Linda Living Trust and Nguyen
Current Estimated Value
Purchase Details
Closed on
Nov 7, 2011
Sold by
Nguyen Dominic
Bought by
Nguyen Henry and Nguyen Linda
Purchase Details
Closed on
Apr 19, 2005
Sold by
Nguyen Henry and Nguyen Linda
Bought by
Nguyen Henry and Nguyen Linda
Purchase Details
Closed on
Jul 25, 2002
Sold by
Nguyen Henry and Nguyen Linda
Bought by
Nguyen Henry and Nguyen Linda
Home Financials for this Owner
Home Financials are based on the most recent Mortgage that was taken out on this home.
Original Mortgage
$299,500
Interest Rate
6.6%
Mortgage Type
Purchase Money Mortgage
Create a Home Valuation Report for This Property
The Home Valuation Report is an in-depth analysis detailing your home's value as well as a comparison with similar homes in the area
Home Values in the Area
Average Home Value in this Area
Purchase History
| Date | Buyer | Sale Price | Title Company |
|---|---|---|---|
| Henry & Linda Living Trust | -- | None Listed On Document | |
| Nguyen Henry | $31,818 | None Available | |
| Nguyen Henry | -- | -- | |
| Nguyen Henry | -- | Alliance Title Company | |
| Nguyen Henry | -- | Alliance Title Company |
Source: Public Records
Mortgage History
| Date | Status | Borrower | Loan Amount |
|---|---|---|---|
| Previous Owner | Nguyen Henry | $299,500 |
Source: Public Records
Tax History Compared to Growth
Tax History
| Year | Tax Paid | Tax Assessment Tax Assessment Total Assessment is a certain percentage of the fair market value that is determined by local assessors to be the total taxable value of land and additions on the property. | Land | Improvement |
|---|---|---|---|---|
| 2025 | $5,248 | $265,660 | $73,103 | $192,557 |
| 2024 | $5,178 | $260,452 | $71,670 | $188,782 |
| 2023 | $5,178 | $255,346 | $70,265 | $185,081 |
| 2022 | $5,065 | $250,340 | $68,888 | $181,452 |
| 2021 | $4,992 | $245,433 | $67,538 | $177,895 |
| 2019 | $4,688 | $238,155 | $65,536 | $172,619 |
| 2018 | $4,521 | $233,486 | $64,251 | $169,235 |
| 2017 | $4,410 | $228,909 | $62,992 | $165,917 |
| 2016 | $4,336 | $224,421 | $61,757 | $162,664 |
| 2015 | $4,299 | $221,051 | $60,830 | $160,221 |
| 2014 | $4,260 | $216,722 | $59,639 | $157,083 |
Source: Public Records
Map
Nearby Homes
- 5411 Garvin Ave
- 828 Yuba St
- 826 Amador St
- 5619 Doremus Ave
- 6101 Rosalind Ave
- 5955 Ralston Ave
- 6046 Monterey Ave
- 5400 Clinton Ave
- 692 Yuba St
- 6048 Monterey Ave
- 5851 Ralston Ave
- 5001 Garvin Ave
- 5238 Clinton Ave
- 12664 San Pablo Ave
- 1230 Marin Ave
- 956 Wilson Ave
- 611 Amador St
- 3809 Solano Ave
- 3711 Garvin Ave
- 760 37th St