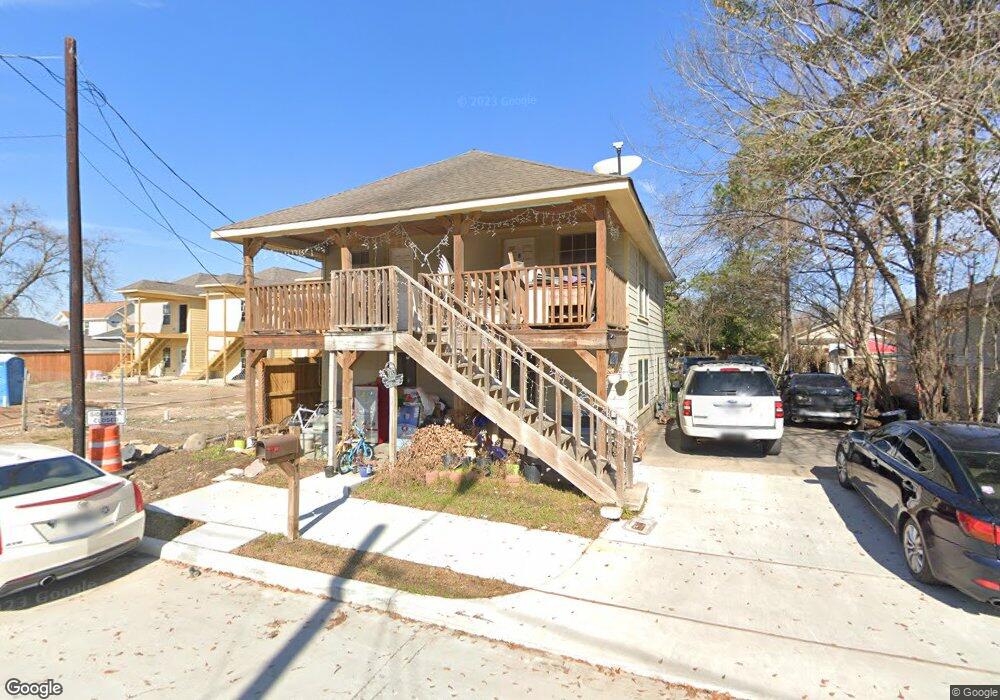
7837 Goode St Houston, TX 77012
Magnolia Park NeighborhoodEstimated Value: $212,000 - $255,000
3
Beds
2
Baths
1,620
Sq Ft
$144/Sq Ft
Est. Value
About This Home
This home is located at 7837 Goode St, Houston, TX 77012 and is currently estimated at $232,970, approximately $143 per square foot. 7837 Goode St is a home located in Harris County with nearby schools including Gallegos Elementary School, Edison Middle, and Milby High School.
Ownership History
Date
Name
Owned For
Owner Type
Purchase Details
Closed on
Apr 28, 2022
Sold by
Berard Rubalcada Jr Lee
Bought by
City Of Houston
Current Estimated Value
Home Financials for this Owner
Home Financials are based on the most recent Mortgage that was taken out on this home.
Original Mortgage
$144,000
Outstanding Balance
$136,612
Interest Rate
5.1%
Mortgage Type
New Conventional
Estimated Equity
$96,358
Purchase Details
Closed on
Mar 31, 2022
Sold by
Monica Myers
Bought by
Plan B Financial Llc
Home Financials for this Owner
Home Financials are based on the most recent Mortgage that was taken out on this home.
Original Mortgage
$144,000
Outstanding Balance
$136,612
Interest Rate
5.1%
Mortgage Type
New Conventional
Estimated Equity
$96,358
Purchase Details
Closed on
Dec 7, 2021
Sold by
Youngblood Eldon L
Bought by
Myers Monica
Purchase Details
Closed on
Jul 31, 1999
Sold by
Montiel Juan A and Perez Orfelinda
Bought by
Montiel Maria L
Create a Home Valuation Report for This Property
The Home Valuation Report is an in-depth analysis detailing your home's value as well as a comparison with similar homes in the area
Home Values in the Area
Average Home Value in this Area
Purchase History
| Date | Buyer | Sale Price | Title Company |
|---|---|---|---|
| City Of Houston | -- | None Listed On Document | |
| Rubalcada Lee Berardo | -- | None Listed On Document | |
| Plan B Financial Llc | -- | None Listed On Document | |
| Myers Monica | $121,000 | Bonial & Associates Pc | |
| Montiel Maria L | -- | -- |
Source: Public Records
Mortgage History
| Date | Status | Borrower | Loan Amount |
|---|---|---|---|
| Open | Rubalcada Lee Berardo | $144,000 |
Source: Public Records
Tax History Compared to Growth
Tax History
| Year | Tax Paid | Tax Assessment Tax Assessment Total Assessment is a certain percentage of the fair market value that is determined by local assessors to be the total taxable value of land and additions on the property. | Land | Improvement |
|---|---|---|---|---|
| 2025 | $3,656 | $177,796 | $75,000 | $102,796 |
| 2024 | $3,656 | $174,728 | $75,000 | $99,728 |
| 2023 | $3,656 | $155,172 | $75,000 | $80,172 |
| 2022 | $3,012 | $128,067 | $60,000 | $68,067 |
| 2021 | $2,233 | $117,045 | $40,000 | $77,045 |
| 2020 | $2,240 | $112,095 | $40,000 | $72,095 |
| 2019 | $2,123 | $110,956 | $37,500 | $73,456 |
| 2018 | $1,163 | $71,997 | $31,750 | $40,247 |
| 2017 | $1,928 | $71,997 | $31,750 | $40,247 |
| 2016 | $1,781 | $66,484 | $31,750 | $34,734 |
| 2015 | $1,195 | $66,484 | $31,750 | $34,734 |
| 2014 | $1,195 | $66,484 | $31,750 | $34,734 |
Source: Public Records
Map
Nearby Homes
- 716 S 79th St
- 7909 Goode St
- 7912 Ford St
- 7846 Dayton St
- 7939 Goode St
- 106 Kemton St
- 7941 Goode St
- 7932 Brays St
- 7815 Dayton St
- 0 Dayton St
- 0 Brays St
- 147 Woodvale St Unit A
- 7828 Harrisburg Blvd
- 8021 Harrisburg Blvd
- 123 Canton St
- 125 Canton St
- 7634 Harrisburg Blvd
- 7934 Sherman St
- 7803 Avenue E
- 7805 Avenue E
- 7829 Goode St Unit B
- 7839 Goode St
- 7827 Goode St
- 7827 Goode St Unit B
- 7827 Goode St Unit A
- 7825 Goode St Unit A
- 7841 Goode St
- 7821 Goode St
- 7834 Ford St
- 7830 Ford St
- 7840 Ford St
- 7823 Goode St Unit A
- 7823 Goode St
- 7842 Ford St
- 7819 Goode St
- 7847 Goode St
- 7812 Ford St
- 7834 Goode St
- 7832 Goode St
- 604 S 79th St