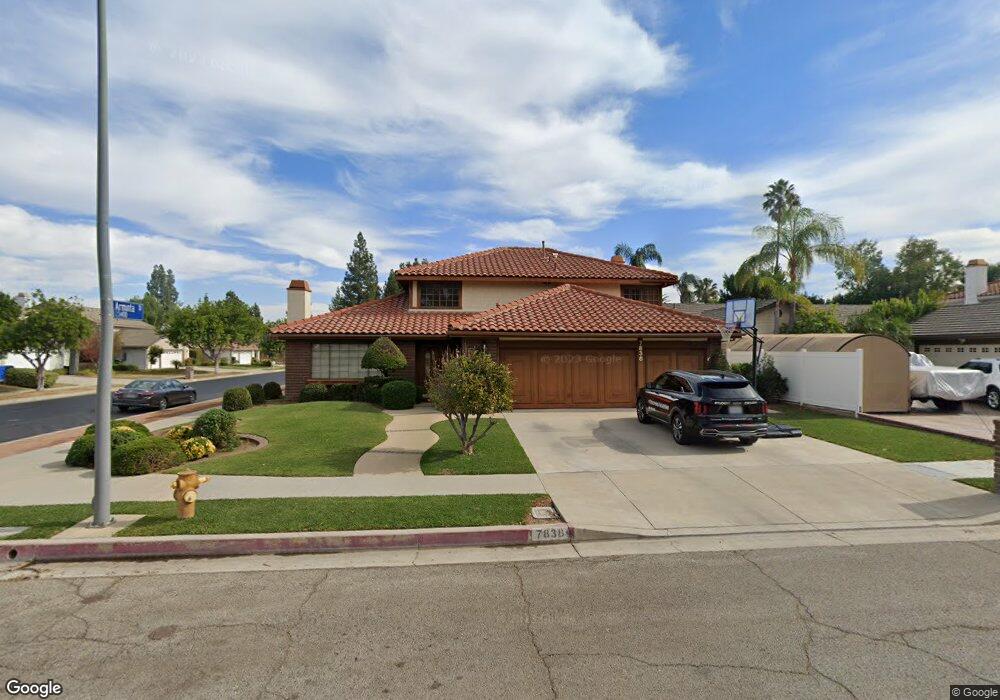
7838 Woodhall Ave Canoga Park, CA 91304
Canoga Park NeighborhoodEstimated Value: $1,222,000 - $1,481,000
4
Beds
3
Baths
3,107
Sq Ft
$441/Sq Ft
Est. Value
About This Home
This home is located at 7838 Woodhall Ave, Canoga Park, CA 91304 and is currently estimated at $1,370,296, approximately $441 per square foot. 7838 Woodhall Ave is a home located in Los Angeles County with nearby schools including Christopher Columbus Middle School, Justice Street Academy Charter, and Pomelo Community Charter.
Ownership History
Date
Name
Owned For
Owner Type
Purchase Details
Closed on
Oct 5, 2016
Sold by
Milewski Francis R and The Francis R Milewski & Marga
Bought by
Milewski Francis R
Current Estimated Value
Home Financials for this Owner
Home Financials are based on the most recent Mortgage that was taken out on this home.
Original Mortgage
$269,000
Interest Rate
3.46%
Mortgage Type
New Conventional
Purchase Details
Closed on
Jul 13, 2010
Sold by
Milewski Francis R
Bought by
Milewski Francis R and Milewski Francis R
Home Financials for this Owner
Home Financials are based on the most recent Mortgage that was taken out on this home.
Original Mortgage
$310,000
Interest Rate
3.5%
Mortgage Type
New Conventional
Purchase Details
Closed on
Oct 1, 1994
Sold by
Milewski Francis R and Milewski Margaret P
Bought by
Milewski Francis R and Milewski Margaret P
Create a Home Valuation Report for This Property
The Home Valuation Report is an in-depth analysis detailing your home's value as well as a comparison with similar homes in the area
Home Values in the Area
Average Home Value in this Area
Purchase History
| Date | Buyer | Sale Price | Title Company |
|---|---|---|---|
| Milewski Francis R | -- | Servicelink Crs | |
| Milewski Francis R | -- | Accommodation | |
| Milewski Francis R | -- | Ticor Title Company | |
| Milewski Francis R | -- | -- |
Source: Public Records
Mortgage History
| Date | Status | Borrower | Loan Amount |
|---|---|---|---|
| Previous Owner | Milewski Francis R | $269,000 | |
| Previous Owner | Milewski Francis R | $310,000 |
Source: Public Records
Tax History Compared to Growth
Tax History
| Year | Tax Paid | Tax Assessment Tax Assessment Total Assessment is a certain percentage of the fair market value that is determined by local assessors to be the total taxable value of land and additions on the property. | Land | Improvement |
|---|---|---|---|---|
| 2025 | $6,967 | $540,180 | $192,170 | $348,010 |
| 2024 | $6,967 | $529,589 | $188,402 | $341,187 |
| 2023 | $6,841 | $519,206 | $184,708 | $334,498 |
| 2022 | $6,457 | $509,027 | $181,087 | $327,940 |
| 2021 | $6,365 | $499,047 | $177,537 | $321,510 |
| 2019 | $6,182 | $484,247 | $172,272 | $311,975 |
| 2018 | $5,994 | $474,753 | $168,895 | $305,858 |
| 2016 | $5,704 | $456,320 | $162,338 | $293,982 |
| 2015 | $5,623 | $449,467 | $159,900 | $289,567 |
| 2014 | $5,648 | $440,663 | $156,768 | $283,895 |
Source: Public Records
Map
Nearby Homes
- 23200 Justice St
- 7556 Chaminade Ave
- 23716 Elkwood St
- 23676 Justice St
- 7729 Sedan Ave
- 8324 Joan Ln
- 7925 Royer Ave
- 23774 Burton St
- 7442 Bobbyboyar Ave
- 8108 Royer Ave
- 23546 Community St
- 7446 Woodlake Ave
- 7422 Kyle Ct
- 23708 Sandalwood St
- 23234 Valerio St
- 23025 Covello St
- 8373 Denise Ln
- 8404 Joan Ln
- 7839 Lena Ave
- 22906 Lanark St
- 7832 Woodhall Ave
- 7824 Woodhall Ave
- 7839 Sadring Ave
- 23425 Arminta St
- 23419 Arminta St
- 7831 Sadring Ave
- 23433 Arminta St
- 23411 Arminta St
- 7820 Woodhall Ave
- 7825 Sadring Ave
- 23455 Arminta St
- 23441 Arminta St
- 23401 Arminta St
- 7817 Sadring Ave
- 23447 Arminta St
- 23424 Blythe St
- 23418 Blythe St
- 7814 Woodhall Ave
- 23432 Blythe St
- 23410 Blythe St