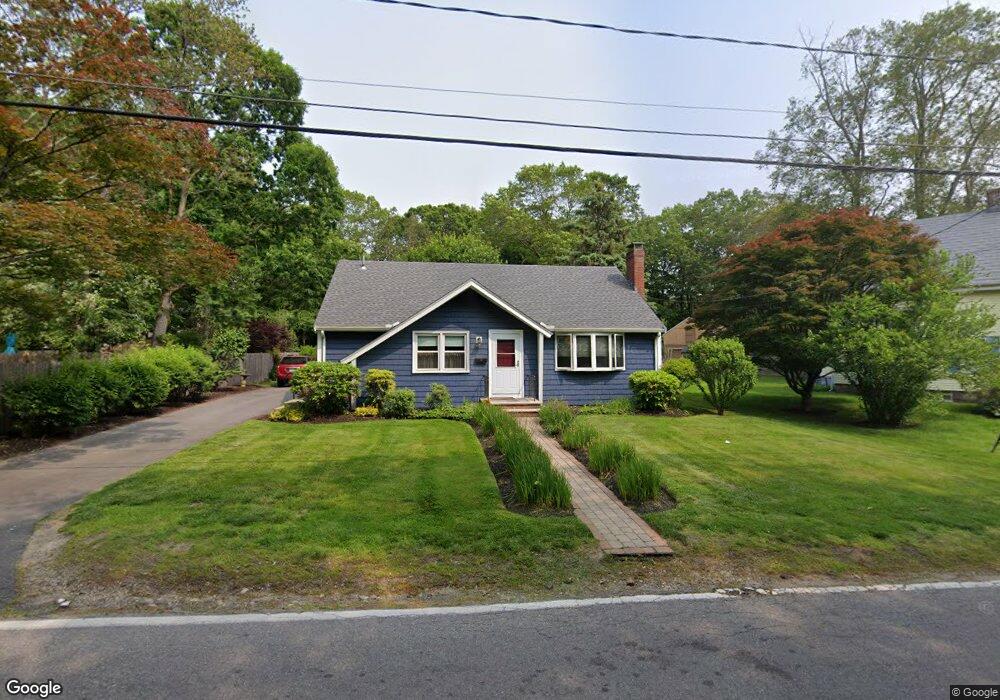
784 East St Brockton, MA 02302
Estimated Value: $437,000 - $515,000
3
Beds
1
Bath
1,174
Sq Ft
$416/Sq Ft
Est. Value
About This Home
This home is located at 784 East St, Brockton, MA 02302 and is currently estimated at $487,988, approximately $415 per square foot. 784 East St is a home located in Plymouth County with nearby schools including Davis K-8 School, John F. Kennedy Elementary School, and South Middle School.
Ownership History
Date
Name
Owned For
Owner Type
Purchase Details
Closed on
Jun 30, 2005
Sold by
John J Buckley T and Buckley John J
Bought by
Shea Christopher A and Shea Kathleen M
Current Estimated Value
Home Financials for this Owner
Home Financials are based on the most recent Mortgage that was taken out on this home.
Original Mortgage
$225,000
Outstanding Balance
$117,983
Interest Rate
5.73%
Mortgage Type
Purchase Money Mortgage
Estimated Equity
$370,005
Purchase Details
Closed on
Apr 30, 2004
Sold by
Buckley John Joseph and Buckley John J
Bought by
John J Buckley T and Buckley John J
Create a Home Valuation Report for This Property
The Home Valuation Report is an in-depth analysis detailing your home's value as well as a comparison with similar homes in the area
Home Values in the Area
Average Home Value in this Area
Purchase History
| Date | Buyer | Sale Price | Title Company |
|---|---|---|---|
| Shea Christopher A | $262,000 | -- | |
| John J Buckley T | -- | -- |
Source: Public Records
Mortgage History
| Date | Status | Borrower | Loan Amount |
|---|---|---|---|
| Open | John J Buckley T | $225,000 |
Source: Public Records
Tax History Compared to Growth
Tax History
| Year | Tax Paid | Tax Assessment Tax Assessment Total Assessment is a certain percentage of the fair market value that is determined by local assessors to be the total taxable value of land and additions on the property. | Land | Improvement |
|---|---|---|---|---|
| 2025 | $5,209 | $430,100 | $165,600 | $264,500 |
| 2024 | $4,914 | $408,800 | $165,600 | $243,200 |
| 2023 | $5,012 | $386,100 | $116,200 | $269,900 |
| 2022 | $4,697 | $336,200 | $105,700 | $230,500 |
| 2021 | $4,222 | $291,200 | $99,300 | $191,900 |
| 2020 | $3,978 | $262,600 | $86,500 | $176,100 |
| 2019 | $4,252 | $273,600 | $83,200 | $190,400 |
| 2018 | $3,660 | $227,900 | $83,200 | $144,700 |
| 2017 | $3,500 | $217,400 | $83,200 | $134,200 |
| 2016 | $3,229 | $186,000 | $79,300 | $106,700 |
| 2015 | $3,133 | $172,600 | $79,300 | $93,300 |
| 2014 | $3,033 | $167,300 | $79,300 | $88,000 |
Source: Public Records
Map
Nearby Homes