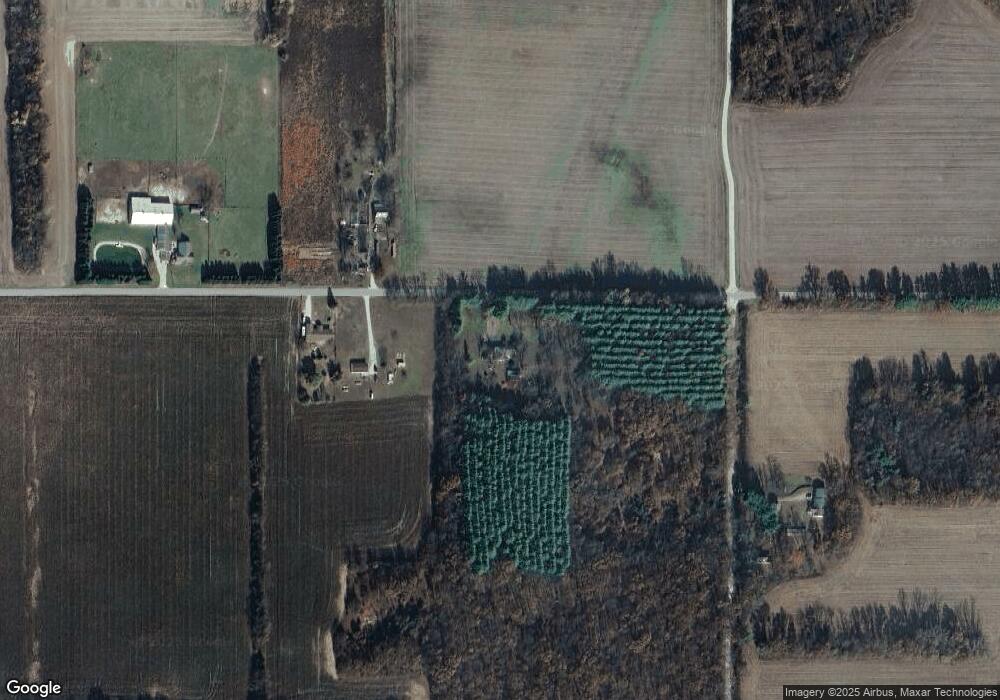
7855 E 200 N Grovertown, IN 46531
Estimated Value: $245,000 - $302,000
2
Beds
2
Baths
1,826
Sq Ft
$152/Sq Ft
Est. Value
About This Home
This home is located at 7855 E 200 N, Grovertown, IN 46531 and is currently estimated at $277,200, approximately $151 per square foot. 7855 E 200 N is a home located in Starke County with nearby schools including Knox Community Elementary School, Knox Community Middle School, and Knox Community High School.
Ownership History
Date
Name
Owned For
Owner Type
Purchase Details
Closed on
May 2, 2008
Sold by
Plate Jan
Bought by
Carpenter Roger W
Current Estimated Value
Home Financials for this Owner
Home Financials are based on the most recent Mortgage that was taken out on this home.
Original Mortgage
$116,000
Interest Rate
5.88%
Mortgage Type
New Conventional
Purchase Details
Closed on
May 23, 2001
Sold by
Tillrock Ronald A
Bought by
Garland Elena
Create a Home Valuation Report for This Property
The Home Valuation Report is an in-depth analysis detailing your home's value as well as a comparison with similar homes in the area
Home Values in the Area
Average Home Value in this Area
Purchase History
| Date | Buyer | Sale Price | Title Company |
|---|---|---|---|
| Carpenter Roger W | -- | Meridian Title Corp | |
| Garland Elena | -- | -- |
Source: Public Records
Mortgage History
| Date | Status | Borrower | Loan Amount |
|---|---|---|---|
| Closed | Carpenter Roger W | $116,000 |
Source: Public Records
Tax History Compared to Growth
Tax History
| Year | Tax Paid | Tax Assessment Tax Assessment Total Assessment is a certain percentage of the fair market value that is determined by local assessors to be the total taxable value of land and additions on the property. | Land | Improvement |
|---|---|---|---|---|
| 2024 | $2,519 | $177,500 | $31,000 | $146,500 |
| 2023 | $1,167 | $160,000 | $27,200 | $132,800 |
| 2022 | $1,212 | $157,100 | $24,500 | $132,600 |
| 2021 | $1,024 | $130,100 | $23,400 | $106,700 |
| 2020 | $1,030 | $117,900 | $23,400 | $94,500 |
| 2019 | $910 | $112,200 | $24,800 | $87,400 |
| 2018 | $841 | $108,100 | $23,600 | $84,500 |
| 2017 | $883 | $108,500 | $28,700 | $79,800 |
| 2016 | $869 | $106,400 | $29,500 | $76,900 |
| 2014 | $778 | $105,900 | $30,100 | $75,800 |
| 2013 | $725 | $103,400 | $28,000 | $75,400 |
Source: Public Records
Map
Nearby Homes