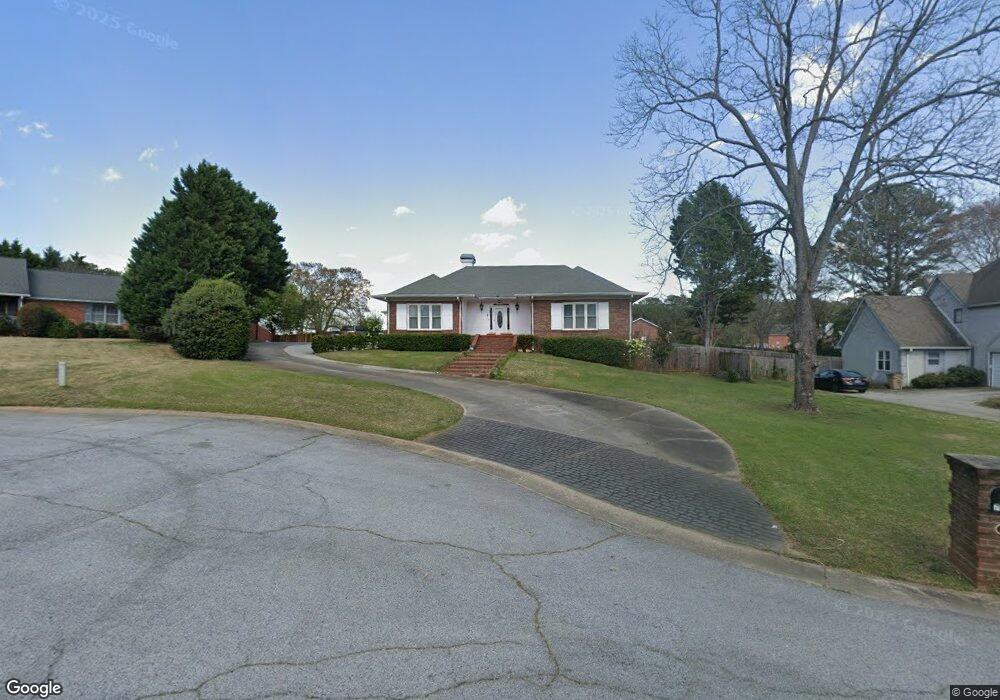
7890 High Point Dr Jonesboro, GA 30236
Estimated Value: $350,000 - $483,000
3
Beds
3
Baths
3,226
Sq Ft
$128/Sq Ft
Est. Value
About This Home
This home is located at 7890 High Point Dr, Jonesboro, GA 30236 and is currently estimated at $413,089, approximately $128 per square foot. 7890 High Point Dr is a home located in Clayton County with nearby schools including Arnold Elementary School, M. D. Roberts Middle School, and Jonesboro High School.
Ownership History
Date
Name
Owned For
Owner Type
Purchase Details
Closed on
Mar 12, 2024
Sold by
Pham Lehoa
Bought by
Lehoa Pham Living Trust Ua Dated March 1
Current Estimated Value
Purchase Details
Closed on
Oct 10, 2019
Sold by
Lafayette Darlene
Bought by
Pham Lehoa
Purchase Details
Closed on
May 7, 2018
Sold by
Pyke
Bought by
Pham Le Hoa and Nguyen Lafayette Darlene
Purchase Details
Closed on
Dec 11, 2001
Sold by
Wigginton James C
Bought by
Wigginton James C and Wigginton Carol A
Home Financials for this Owner
Home Financials are based on the most recent Mortgage that was taken out on this home.
Original Mortgage
$177,750
Interest Rate
6.49%
Mortgage Type
New Conventional
Purchase Details
Closed on
Jul 31, 1995
Sold by
Barbay Harry L Carolyn S
Bought by
Wigginton James C Carol Ann
Create a Home Valuation Report for This Property
The Home Valuation Report is an in-depth analysis detailing your home's value as well as a comparison with similar homes in the area
Home Values in the Area
Average Home Value in this Area
Purchase History
| Date | Buyer | Sale Price | Title Company |
|---|---|---|---|
| Lehoa Pham Living Trust Ua Dated March 1 | -- | -- | |
| Pham Lehoa | $200,000 | -- | |
| Pham Le Hoa | $200,000 | -- | |
| Wigginton James C | -- | -- | |
| Wigginton James C Carol Ann | $227,100 | -- |
Source: Public Records
Mortgage History
| Date | Status | Borrower | Loan Amount |
|---|---|---|---|
| Previous Owner | Wigginton James C | $177,750 | |
| Closed | Wigginton James C Carol Ann | $0 |
Source: Public Records
Tax History Compared to Growth
Tax History
| Year | Tax Paid | Tax Assessment Tax Assessment Total Assessment is a certain percentage of the fair market value that is determined by local assessors to be the total taxable value of land and additions on the property. | Land | Improvement |
|---|---|---|---|---|
| 2024 | $2,798 | $152,160 | $10,400 | $141,760 |
| 2023 | $5,838 | $161,680 | $10,400 | $151,280 |
| 2022 | $2,089 | $116,560 | $10,400 | $106,160 |
| 2021 | $2,102 | $115,880 | $10,400 | $105,480 |
| 2020 | $1,909 | $103,579 | $10,400 | $93,179 |
| 2019 | $1,480 | $80,000 | $10,000 | $70,000 |
| 2018 | $2,088 | $109,518 | $10,000 | $99,518 |
| 2017 | $3,747 | $101,147 | $10,000 | $91,147 |
| 2016 | $3,281 | $89,696 | $10,000 | $79,696 |
| 2015 | $3,264 | $0 | $0 | $0 |
| 2014 | $3,130 | $87,709 | $10,000 | $77,709 |
Source: Public Records
Map
Nearby Homes
- 2846 Highway 138 E
- 2809 Highway 138 E
- 2884 Kevin Ln Unit 2
- 7719 Glen Devon Rd
- 7595 Teton Ct
- 8225 Seven Oaks Dr
- 247 Spivey Ridge Cir
- 733 Berkeley Dr
- 732 Berkeley Dr
- 717 Berkeley Dr
- 706 Berkeley Dr
- 708 Berkeley Dr
- 725 Berkeley Dr
- 710 Berkeley Dr
- 745 Berkeley Dr
- 722 Berkeley Dr
- 718 Berkeley Dr
- 719 Berkeley Dr
- 712 Berkeley Dr
- 734 Berkeley Dr
- 7900 High Point Dr
- 7882 High Point Dr
- 7878 High Point Dr
- 7912 High Point Dr
- 7891 Berry Rd
- 7897 High Point Dr
- 7874 High Point Dr
- 7909 High Point Dr
- 7926 High Point Dr
- 7901 Berry Rd
- 7922 Hillcrest Trail
- 7870 High Point Dr
- 7925 High Point Dr
- 7940 High Point Dr
- 2812 Highway 138 E
- 7936 Hillcrest Trail
- 7939 High Point Dr
- 7921 Berry Rd
- 7948 Hillcrest Trail
- 7909 Hillcrest Trail