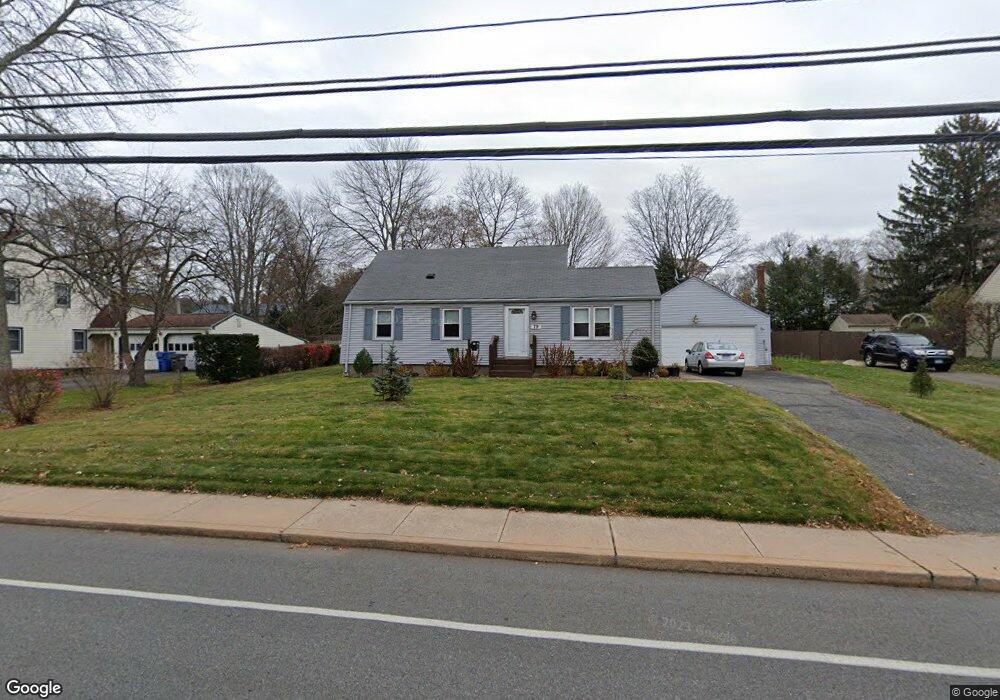
79 Vernon St Manchester, CT 06042
Buckley District NeighborhoodEstimated Value: $303,000 - $327,000
4
Beds
1
Bath
1,269
Sq Ft
$248/Sq Ft
Est. Value
About This Home
This home is located at 79 Vernon St, Manchester, CT 06042 and is currently estimated at $314,826, approximately $248 per square foot. 79 Vernon St is a home located in Hartford County with nearby schools including Buckley School, Illing Middle School, and Elisabeth M. Bennet Academy.
Ownership History
Date
Name
Owned For
Owner Type
Purchase Details
Closed on
Sep 5, 2006
Sold by
Larosa Joseph S and Larosa Julia
Bought by
Robinson F Richard
Current Estimated Value
Home Financials for this Owner
Home Financials are based on the most recent Mortgage that was taken out on this home.
Original Mortgage
$100,000
Interest Rate
5.75%
Purchase Details
Closed on
Dec 20, 1989
Sold by
James Richard Est
Bought by
James Robert L
Create a Home Valuation Report for This Property
The Home Valuation Report is an in-depth analysis detailing your home's value as well as a comparison with similar homes in the area
Home Values in the Area
Average Home Value in this Area
Purchase History
| Date | Buyer | Sale Price | Title Company |
|---|---|---|---|
| Robinson F Richard | $200,000 | -- | |
| Robinson F Richard | $200,000 | -- | |
| James Robert L | $14,666 | -- |
Source: Public Records
Mortgage History
| Date | Status | Borrower | Loan Amount |
|---|---|---|---|
| Open | James Robert L | $247,500 | |
| Closed | James Robert L | $100,000 | |
| Closed | James Robert L | $100,000 |
Source: Public Records
Tax History Compared to Growth
Tax History
| Year | Tax Paid | Tax Assessment Tax Assessment Total Assessment is a certain percentage of the fair market value that is determined by local assessors to be the total taxable value of land and additions on the property. | Land | Improvement |
|---|---|---|---|---|
| 2025 | $5,869 | $147,400 | $39,500 | $107,900 |
| 2024 | $5,701 | $147,400 | $39,500 | $107,900 |
| 2023 | $5,483 | $147,400 | $39,500 | $107,900 |
| 2022 | $5,324 | $147,400 | $39,500 | $107,900 |
| 2021 | $4,746 | $113,200 | $33,900 | $79,300 |
| 2020 | $4,740 | $113,200 | $33,900 | $79,300 |
| 2019 | $4,720 | $113,200 | $33,900 | $79,300 |
| 2018 | $4,631 | $113,200 | $33,900 | $79,300 |
| 2017 | $4,500 | $113,200 | $33,900 | $79,300 |
| 2016 | $4,615 | $116,300 | $43,000 | $73,300 |
| 2015 | $4,582 | $116,300 | $43,000 | $73,300 |
| 2014 | $4,495 | $116,300 | $43,000 | $73,300 |
Source: Public Records
Map
Nearby Homes