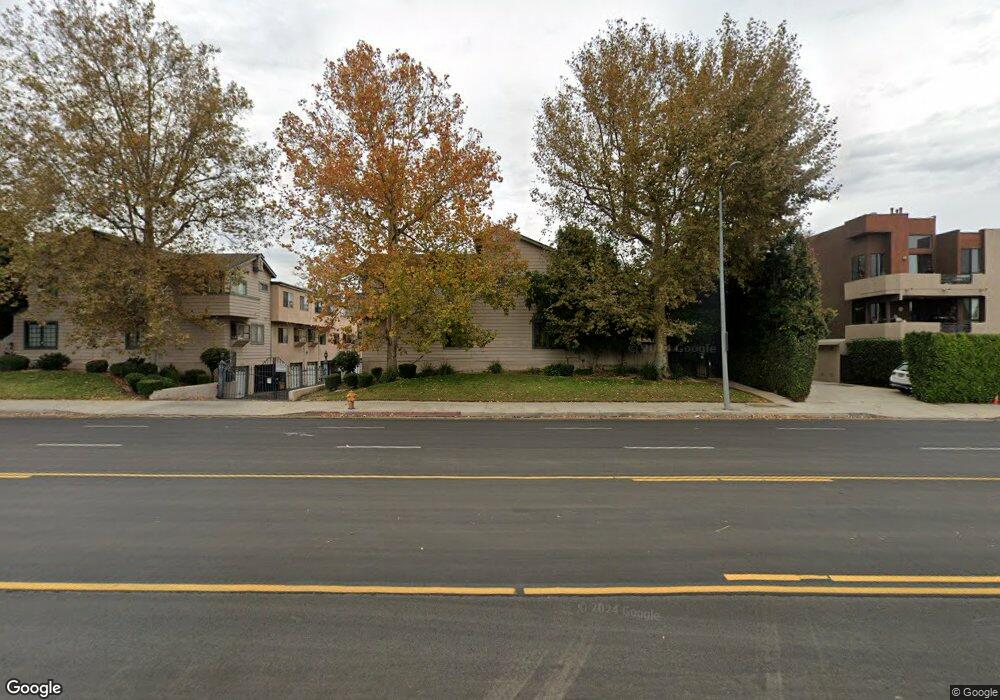
7900 Topanga Cyn Blvd Unit 13 Canoga Park, CA 91304
Canoga Park NeighborhoodEstimated Value: $587,000 - $751,000
3
Beds
3
Baths
1,626
Sq Ft
$406/Sq Ft
Est. Value
About This Home
This home is located at 7900 Topanga Cyn Blvd Unit 13, Canoga Park, CA 91304 and is currently estimated at $660,389, approximately $406 per square foot. 7900 Topanga Cyn Blvd Unit 13 is a home located in Los Angeles County with nearby schools including Canoga Park Elementary School, Christopher Columbus Middle School, and Canoga Park Senior High School.
Ownership History
Date
Name
Owned For
Owner Type
Purchase Details
Closed on
Aug 19, 2019
Sold by
Sabio Adonis Nicanor and Sabio Kristine Rodriguez
Bought by
Sabio Adonis Nicanor and Sabio Kristine Rodriguez
Current Estimated Value
Home Financials for this Owner
Home Financials are based on the most recent Mortgage that was taken out on this home.
Original Mortgage
$402,000
Outstanding Balance
$352,078
Interest Rate
3.7%
Mortgage Type
New Conventional
Estimated Equity
$308,311
Purchase Details
Closed on
Feb 1, 2018
Sold by
Hyman Bruce
Bought by
Sabio Adonis Nicanor and Dumo Kristine Rodriguez
Home Financials for this Owner
Home Financials are based on the most recent Mortgage that was taken out on this home.
Original Mortgage
$404,000
Interest Rate
4.04%
Mortgage Type
New Conventional
Purchase Details
Closed on
Mar 24, 1994
Sold by
7900-04 Topanga Cyn Inc
Bought by
Hyman Bruce
Home Financials for this Owner
Home Financials are based on the most recent Mortgage that was taken out on this home.
Original Mortgage
$136,000
Interest Rate
4%
Create a Home Valuation Report for This Property
The Home Valuation Report is an in-depth analysis detailing your home's value as well as a comparison with similar homes in the area
Home Values in the Area
Average Home Value in this Area
Purchase History
| Date | Buyer | Sale Price | Title Company |
|---|---|---|---|
| Sabio Adonis Nicanor | -- | Provident Title Company | |
| Sabio Adonis Nicanor | $449,000 | Priority Title | |
| Hyman Bruce | $170,000 | Old Republic Title Company |
Source: Public Records
Mortgage History
| Date | Status | Borrower | Loan Amount |
|---|---|---|---|
| Open | Sabio Adonis Nicanor | $402,000 | |
| Closed | Sabio Adonis Nicanor | $404,000 | |
| Previous Owner | Hyman Bruce | $136,000 | |
| Closed | Hyman Bruce | $17,000 |
Source: Public Records
Tax History Compared to Growth
Tax History
| Year | Tax Paid | Tax Assessment Tax Assessment Total Assessment is a certain percentage of the fair market value that is determined by local assessors to be the total taxable value of land and additions on the property. | Land | Improvement |
|---|---|---|---|---|
| 2025 | $6,242 | $510,878 | $353,406 | $157,472 |
| 2024 | $6,242 | $500,862 | $346,477 | $154,385 |
| 2023 | $6,122 | $491,042 | $339,684 | $151,358 |
| 2022 | $5,838 | $481,415 | $333,024 | $148,391 |
| 2021 | $5,761 | $471,977 | $326,495 | $145,482 |
| 2019 | $5,589 | $457,980 | $316,812 | $141,168 |
| 2018 | $3,220 | $253,922 | $110,529 | $143,393 |
| 2016 | $3,064 | $244,064 | $106,238 | $137,826 |
| 2015 | $3,021 | $240,399 | $104,643 | $135,756 |
| 2014 | $3,037 | $235,691 | $102,594 | $133,097 |
Source: Public Records
Map
Nearby Homes
- 7826 Topanga Unit 213
- 7934 Vassar Ave
- 7826 Topanga Canyon Blvd Unit 218
- 7826 Topanga Canyon Blvd Unit 301
- 7826 Topanga Canyon Blvd Unit 231
- 7800 Topanga Canyon Blvd Unit 208
- 7845 Nevada Ave
- 7650 Topanga Canyon Blvd Unit 14
- 22151 Ingomar St
- 7725 Owensmouth Ave
- 22158 Elkwood St
- 7716 Owensmouth Ave
- 7605 Jordan Ave Unit 6
- 22128 Burton St
- 22020 Saticoy St
- 7551 Jordan Ave Unit 405
- 7551 Jordan Ave Unit 109
- 7519 Owensmouth Ave
- 7749 Nita Ave
- 7816 Shoup Ave
- 7904 Topanga Canyon Blvd Unit 3
- 7904 Topanga Canyon Blvd Unit 1
- 7904 Topanga Canyon Blvd Unit 7
- 7904 Topanga Canyon Blvd Unit 6
- 7904 Topanga Canyon Blvd Unit 4
- 7904 Topanga Canyon Blvd Unit 8
- 7904 Topanga Canyon Blvd
- 7904 Topanga Canyon Blvd Unit 2
- 7904 Topanga Canyon Blvd Unit 5
- 7900 Topanga Cyn Blvd Unit 20
- 7900 Topanga Cyn Blvd Unit 21
- 7900 Topanga Cyn Blvd Unit 19
- 7900 Topanga Cyn Blvd Unit 18
- 7900 Topanga Cyn Blvd Unit 17
- 7900 Topanga Cyn Blvd Unit 16
- 7900 Topanga Cyn Blvd Unit 15
- 7900 Topanga Cyn Blvd Unit 14
- 7900 Topanga Cyn Blvd Unit 12
- 7900 Topanga Cyn Blvd Unit 11
- 7904 Topanga Cyn Blvd Unit 10