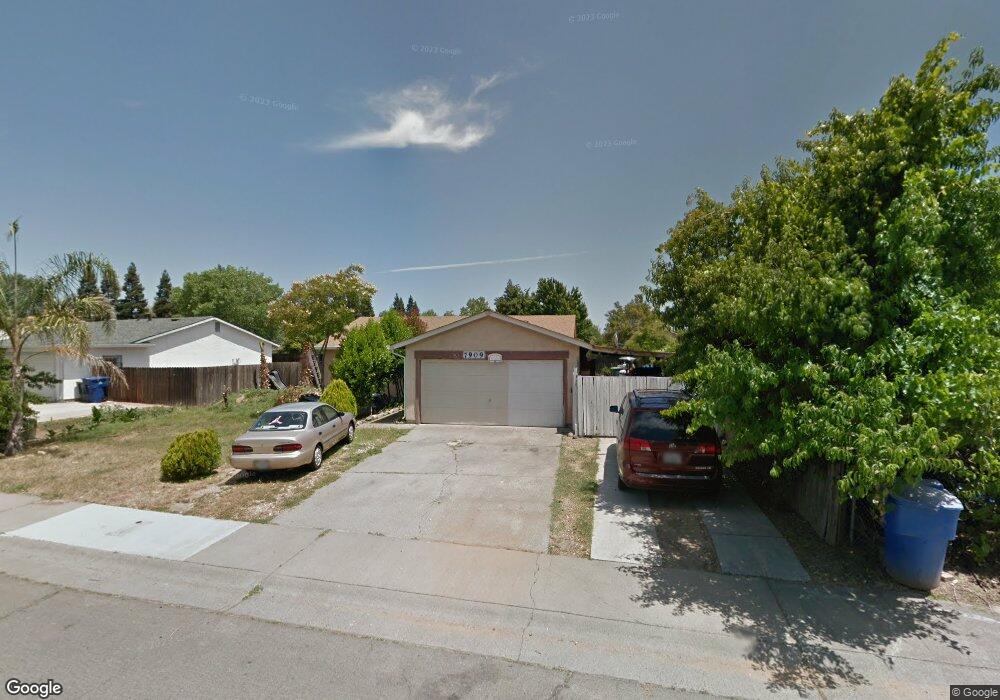
7909 Kenelworth Way Sacramento, CA 95823
North Laguna NeighborhoodEstimated Value: $377,000 - $455,000
4
Beds
2
Baths
1,208
Sq Ft
$346/Sq Ft
Est. Value
About This Home
This home is located at 7909 Kenelworth Way, Sacramento, CA 95823 and is currently estimated at $417,656, approximately $345 per square foot. 7909 Kenelworth Way is a home located in Sacramento County with nearby schools including Prairie Elementary School, Samuel Jackman Middle School, and Valley High School.
Ownership History
Date
Name
Owned For
Owner Type
Purchase Details
Closed on
Mar 9, 2017
Sold by
Oliano Frederick
Bought by
Oliano Frederick and Omas Imelda
Current Estimated Value
Purchase Details
Closed on
Sep 19, 2008
Sold by
Deutsche Bank National Trust Company
Bought by
Oliano Frederick
Home Financials for this Owner
Home Financials are based on the most recent Mortgage that was taken out on this home.
Original Mortgage
$109,035
Interest Rate
6.07%
Mortgage Type
FHA
Purchase Details
Closed on
Jun 9, 2008
Sold by
Magana Azucena L
Bought by
Deutsche Bank National Trust Co and Long Beach Mortgage Loan Trust 2006-1
Purchase Details
Closed on
Dec 13, 2005
Sold by
Stockton Jerome and Stockton Cynthia Y
Bought by
Magana Azucena L
Home Financials for this Owner
Home Financials are based on the most recent Mortgage that was taken out on this home.
Original Mortgage
$250,400
Interest Rate
8.2%
Mortgage Type
Purchase Money Mortgage
Create a Home Valuation Report for This Property
The Home Valuation Report is an in-depth analysis detailing your home's value as well as a comparison with similar homes in the area
Home Values in the Area
Average Home Value in this Area
Purchase History
| Date | Buyer | Sale Price | Title Company |
|---|---|---|---|
| Oliano Frederick | -- | None Available | |
| Oliano Frederick | -- | None Available | |
| Oliano Frederick | $113,000 | Lsi Title Company | |
| Deutsche Bank National Trust Co | $138,000 | None Available | |
| Magana Azucena L | $313,000 | Alliance Title Company |
Source: Public Records
Mortgage History
| Date | Status | Borrower | Loan Amount |
|---|---|---|---|
| Previous Owner | Oliano Frederick | $109,035 | |
| Previous Owner | Magana Azucena L | $250,400 |
Source: Public Records
Tax History Compared to Growth
Tax History
| Year | Tax Paid | Tax Assessment Tax Assessment Total Assessment is a certain percentage of the fair market value that is determined by local assessors to be the total taxable value of land and additions on the property. | Land | Improvement |
|---|---|---|---|---|
| 2025 | $1,747 | $145,499 | $51,502 | $93,997 |
| 2024 | $1,747 | $142,647 | $50,493 | $92,154 |
| 2023 | $1,695 | $139,851 | $49,503 | $90,348 |
| 2022 | $1,679 | $137,110 | $48,533 | $88,577 |
| 2021 | $1,649 | $134,423 | $47,582 | $86,841 |
| 2020 | $1,622 | $133,046 | $47,095 | $85,951 |
| 2019 | $1,593 | $130,438 | $46,172 | $84,266 |
| 2018 | $1,549 | $127,881 | $45,267 | $82,614 |
| 2017 | $1,443 | $125,375 | $44,380 | $80,995 |
| 2016 | $1,406 | $122,917 | $43,510 | $79,407 |
| 2015 | $1,372 | $121,072 | $42,857 | $78,215 |
| 2014 | $1,358 | $118,701 | $42,018 | $76,683 |
Source: Public Records
Map
Nearby Homes
- 5385 Bamford Dr
- 6420 S Elder Ct
- 86 Thatcher Cir
- 5975 Bamford Dr
- 4790 Valley hi Dr
- 5530 Seyferth Way
- 5953 Bamford Dr
- 6119 Bamford Dr
- 8018 Center Pkwy
- 7741 Telfer Way
- 7864 Monaldo Walk
- 4515 Montril Way
- 7839 Brizio Walk
- 7948 Grandstaff Dr
- 7952 Grandstaff Dr
- 8160 Valley Green Dr
- 7835 Zaragoza Walk
- 5045 N Laguna Dr
- 8169 Valley Green Dr
- 7829 Acorri Walk
- 7903 Kenelworth Way
- 5405 Great Smokey St
- 5425 Great Smokey St
- 5450 Bamford Dr
- 5445 Great Smokey St
- 7897 Kenelworth Way
- 7908 Kenelworth Way
- 7914 Kenelworth Way
- 7902 Kenelworth Way
- 5465 Great Smokey St
- 7918 Kenelworth Way
- 5420 Bamford Dr
- 5460 Bamford Dr
- 7898 Kenelworth Way
- 7891 Kenelworth Way
- 5485 Great Smokey St
- 5420 Great Smokey St
- 5400 Great Smokey St
- 7894 Kenelworth Way
- 7909 Pedrick St