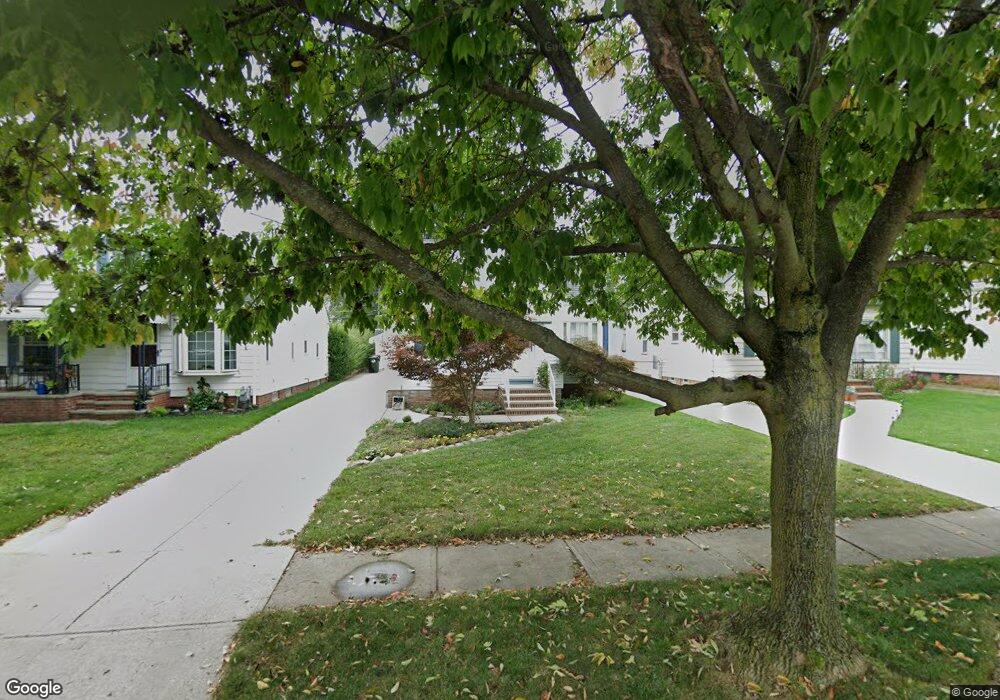
7911 Wainstead Dr Cleveland, OH 44129
Estimated Value: $179,575 - $211,000
3
Beds
1
Bath
976
Sq Ft
$202/Sq Ft
Est. Value
About This Home
This home is located at 7911 Wainstead Dr, Cleveland, OH 44129 and is currently estimated at $197,144, approximately $201 per square foot. 7911 Wainstead Dr is a home located in Cuyahoga County with nearby schools including Greenbriar Middle School, Thoreau Park Elementary School, and Parma High School.
Ownership History
Date
Name
Owned For
Owner Type
Purchase Details
Closed on
Dec 11, 2007
Sold by
Scotti Frank J and Scotti Marilyn R
Bought by
Scotti Marilyn R
Current Estimated Value
Purchase Details
Closed on
Sep 22, 2003
Sold by
Scotti Marilyn R and Scotti Frank J
Bought by
Scotti Frank J and Scotti Marilyn R
Purchase Details
Closed on
Mar 8, 1999
Sold by
Emery Richelle
Bought by
Scotti Marilyn R
Purchase Details
Closed on
Jul 6, 1994
Sold by
Sabo Andrew
Bought by
Emery Richelle
Home Financials for this Owner
Home Financials are based on the most recent Mortgage that was taken out on this home.
Original Mortgage
$43,000
Interest Rate
6.7%
Mortgage Type
New Conventional
Purchase Details
Closed on
Apr 15, 1987
Sold by
Cukr Clarence J
Bought by
Sabo Andrew and Sabo Susann
Purchase Details
Closed on
Aug 14, 1978
Sold by
Cukr Clarence J and Cukr Rose C
Bought by
Cukr Clarence J
Purchase Details
Closed on
Jan 1, 1975
Bought by
Cukr Clarence J and Cukr Rose C
Create a Home Valuation Report for This Property
The Home Valuation Report is an in-depth analysis detailing your home's value as well as a comparison with similar homes in the area
Home Values in the Area
Average Home Value in this Area
Purchase History
| Date | Buyer | Sale Price | Title Company |
|---|---|---|---|
| Scotti Marilyn R | -- | None Available | |
| Scotti Frank J | -- | -- | |
| Scotti Marilyn R | $90,000 | Affiliated Title | |
| Emery Richelle | $73,000 | -- | |
| Sabo Andrew | $50,000 | -- | |
| Cukr Clarence J | -- | -- | |
| Cukr Clarence J | -- | -- |
Source: Public Records
Mortgage History
| Date | Status | Borrower | Loan Amount |
|---|---|---|---|
| Previous Owner | Emery Richelle | $43,000 |
Source: Public Records
Tax History Compared to Growth
Tax History
| Year | Tax Paid | Tax Assessment Tax Assessment Total Assessment is a certain percentage of the fair market value that is determined by local assessors to be the total taxable value of land and additions on the property. | Land | Improvement |
|---|---|---|---|---|
| 2024 | $2,860 | $55,650 | $10,500 | $45,150 |
| 2023 | $2,359 | $41,270 | $9,280 | $31,990 |
| 2022 | $2,361 | $41,270 | $9,280 | $31,990 |
| 2021 | $2,426 | $41,270 | $9,280 | $31,990 |
| 2020 | $1,984 | $31,750 | $7,140 | $24,610 |
| 2019 | $1,878 | $90,700 | $20,400 | $70,300 |
| 2018 | $1,889 | $31,750 | $7,140 | $24,610 |
| 2017 | $1,751 | $28,490 | $6,160 | $22,330 |
| 2016 | $1,741 | $28,490 | $6,160 | $22,330 |
| 2015 | $1,646 | $28,490 | $6,160 | $22,330 |
| 2014 | $1,646 | $29,090 | $6,300 | $22,790 |
Source: Public Records
Map
Nearby Homes
- 8017 Wainstead Dr
- 8017 Ackley Rd
- 6298 Chestnut Hills Dr
- 6439 Keltonshire Rd
- 6227 Ridge Rd
- 6430 Monmouth Dr
- 6234 N Canterbury Rd
- 6136 Ridge Rd
- 8314 Oxford Dr
- 6168 Manchester Rd
- 8218 Covington Ave
- 6485 Buckingham Dr
- 6474 Ridge Rd
- 6111 Manchester Rd
- 6921 Hollywood Dr
- 7503 Whittington Dr
- 8514 Deerfield Dr
- 6510 Belmere Dr
- 6096 Wareham Dr
- 6413 Alderwood Rd
- 7915 Wainstead Dr
- 7907 Wainstead Dr
- 7919 Wainstead Dr
- 8001 Wainstead Dr
- 7912 Ackley Rd
- 7916 Ackley Rd
- 7920 Ackley Rd
- 8005 Wainstead Dr
- 7811 Wainstead Dr
- 7840 Ackley Rd
- 7910 Wainstead Dr
- 8000 Ackley Rd
- 7914 Wainstead Dr
- 7906 Wainstead Dr
- 7918 Wainstead Dr
- 8009 Wainstead Dr
- 7807 Wainstead Dr
- 7810 Ackley Rd
- 8004 Ackley Rd
- 7876 Wainstead Dr