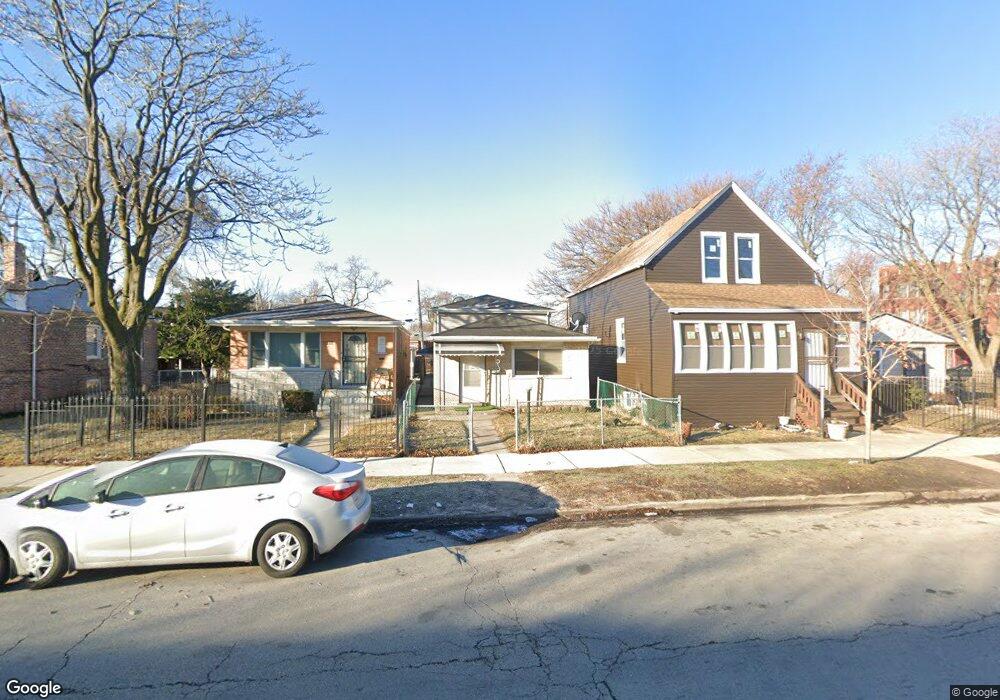
7920 S Anthony Ave Chicago, IL 60619
Grand Crossing NeighborhoodEstimated Value: $99,000 - $166,000
3
Beds
2
Baths
950
Sq Ft
$149/Sq Ft
Est. Value
About This Home
This home is located at 7920 S Anthony Ave, Chicago, IL 60619 and is currently estimated at $141,619, approximately $149 per square foot. 7920 S Anthony Ave is a home located in Cook County with nearby schools including Emil G. Hirsch Metropolitan High School, Betty Shabazz Academy, and CICS Avalon.
Ownership History
Date
Name
Owned For
Owner Type
Purchase Details
Closed on
Feb 28, 2021
Sold by
Floyd George
Bought by
G And D Real Estate Holdings Llc
Current Estimated Value
Purchase Details
Closed on
Nov 17, 2020
Sold by
Norcap 1 Llc
Bought by
Floyd George
Purchase Details
Closed on
Jun 11, 2018
Sold by
Harbour Portfolio Vi Lp
Bought by
Norcap 1 Llc
Purchase Details
Closed on
Sep 20, 2011
Sold by
Harbour Portfolio Vi Lp
Bought by
Floyd George
Purchase Details
Closed on
May 5, 2011
Sold by
Fannie Mae
Bought by
Harbour Portfolio Vi Lp
Purchase Details
Closed on
Jun 24, 2010
Sold by
Prather Denise and Prather Andre
Bought by
Federal National Mortgage Association
Purchase Details
Closed on
Dec 27, 1994
Sold by
Washington Yvonne
Bought by
Prather Andre and Prather Denise
Home Financials for this Owner
Home Financials are based on the most recent Mortgage that was taken out on this home.
Original Mortgage
$70,950
Interest Rate
9.24%
Mortgage Type
FHA
Create a Home Valuation Report for This Property
The Home Valuation Report is an in-depth analysis detailing your home's value as well as a comparison with similar homes in the area
Home Values in the Area
Average Home Value in this Area
Purchase History
| Date | Buyer | Sale Price | Title Company |
|---|---|---|---|
| G And D Real Estate Holdings Llc | -- | Attorney | |
| Floyd George | $40,000 | Attorney | |
| Norcap 1 Llc | $22,545 | None Available | |
| Floyd George | $40,700 | None Available | |
| Harbour Portfolio Vi Lp | $4,883 | None Available | |
| Federal National Mortgage Association | -- | None Available | |
| Prather Andre | $71,000 | -- |
Source: Public Records
Mortgage History
| Date | Status | Borrower | Loan Amount |
|---|---|---|---|
| Previous Owner | Prather Andre | $70,950 |
Source: Public Records
Tax History Compared to Growth
Tax History
| Year | Tax Paid | Tax Assessment Tax Assessment Total Assessment is a certain percentage of the fair market value that is determined by local assessors to be the total taxable value of land and additions on the property. | Land | Improvement |
|---|---|---|---|---|
| 2024 | $1,266 | $10,300 | $2,441 | $7,859 |
| 2023 | $1,234 | $6,000 | $4,069 | $1,931 |
| 2022 | $1,234 | $6,000 | $4,069 | $1,931 |
| 2021 | $1,206 | $5,999 | $4,068 | $1,931 |
| 2020 | $2,468 | $11,078 | $2,929 | $8,149 |
| 2019 | $2,473 | $12,309 | $2,929 | $9,380 |
| 2018 | $1,753 | $12,309 | $2,929 | $9,380 |
| 2017 | $2,270 | $13,920 | $2,604 | $11,316 |
| 2016 | $2,288 | $13,920 | $2,604 | $11,316 |
| 2015 | $2,070 | $13,920 | $2,604 | $11,316 |
| 2014 | $1,821 | $12,383 | $2,278 | $10,105 |
| 2013 | $1,774 | $12,383 | $2,278 | $10,105 |
Source: Public Records
Map
Nearby Homes
- 7930 S Anthony Ave
- 7948 S Anthony Ave
- 8005 S Blackstone Ave
- 8035 S Blackstone Ave
- 8041 S Blackstone Ave
- 8106 S Harper Ave
- 7839 S Kimbark Ave
- 8138 S Harper Ave
- 7931 S East End Ave
- 7747 S Cornell Ave
- 7842 S Ridgeland Ave
- 8129 S Cornell Ave
- 8007 S Avalon Ave
- 8101 S Kimbark Ave
- 7730 S East End Ave
- 8200 S Harper Ave
- 7743 S East End Ave
- 8114 S Anthony Ave
- 8055 S Avalon Ave
- 7642 S Dante Ave
- 7922 S Anthony Ave
- 7918 S Anthony Ave
- 7914 S Anthony Ave
- 7926 S Anthony Ave
- 7928 S Anthony Ave
- 7932 S Anthony Ave
- 7935 S Blackstone Ave
- 7936 S Anthony Ave
- 7924 S Blackstone Ave
- 7922 S Blackstone Ave
- 7928 S Blackstone Ave
- 7930 S Blackstone Ave
- 7940 S Anthony Ave
- 7914 S Blackstone Ave Unit 1
- 7945 S Blackstone Ave
- 7934 S Blackstone Ave
- 7910 S Blackstone Ave
- 7942 S Anthony Ave
- 7936 S Blackstone Ave