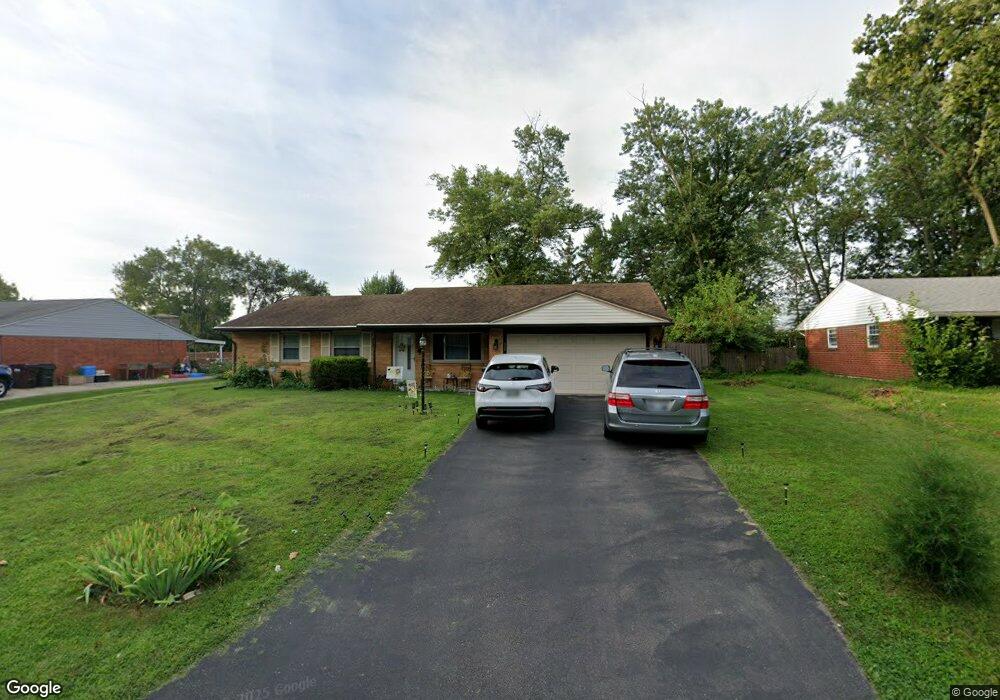
7924 Washington Park Dr Dayton, OH 45459
Woodbourne-Hyde Park NeighborhoodEstimated Value: $216,000 - $236,000
3
Beds
1
Bath
1,243
Sq Ft
$183/Sq Ft
Est. Value
About This Home
This home is located at 7924 Washington Park Dr, Dayton, OH 45459 and is currently estimated at $227,937, approximately $183 per square foot. 7924 Washington Park Dr is a home located in Montgomery County with nearby schools including Miamisburg High School, Bishop Leibold School, and Dayton Christian School.
Ownership History
Date
Name
Owned For
Owner Type
Purchase Details
Closed on
Dec 15, 2011
Sold by
Aneet & Ganeev Properties Llc
Bought by
Gomes Soccorro and Gomes Pleady P
Current Estimated Value
Home Financials for this Owner
Home Financials are based on the most recent Mortgage that was taken out on this home.
Original Mortgage
$76,000
Outstanding Balance
$52,014
Interest Rate
4.02%
Mortgage Type
Purchase Money Mortgage
Estimated Equity
$175,923
Purchase Details
Closed on
Aug 10, 2010
Sold by
Pennymac Loan Services Llc
Bought by
Aneet Ganeev Properties Llc
Purchase Details
Closed on
Apr 7, 2010
Sold by
Morequity Inc
Bought by
Pennymac Loan Services Llc
Purchase Details
Closed on
Feb 23, 2010
Sold by
Cotterman James D
Bought by
Morequity Inc
Purchase Details
Closed on
Oct 9, 2009
Sold by
Cotterman Jill M
Bought by
Cotterman James D
Purchase Details
Closed on
Nov 30, 1998
Sold by
Gammell Violet G and Gammell Violet
Bought by
Cotterman Jill M
Create a Home Valuation Report for This Property
The Home Valuation Report is an in-depth analysis detailing your home's value as well as a comparison with similar homes in the area
Home Values in the Area
Average Home Value in this Area
Purchase History
| Date | Buyer | Sale Price | Title Company |
|---|---|---|---|
| Gomes Soccorro | $95,000 | Sterling Title Inc | |
| Aneet Ganeev Properties Llc | $79,000 | Attorney | |
| Pennymac Loan Services Llc | -- | Attorney | |
| Morequity Inc | -- | Attorney | |
| Cotterman James D | -- | Attorney | |
| Cotterman Jill M | $94,500 | -- | |
| Cotterman James D | $94,500 | -- |
Source: Public Records
Mortgage History
| Date | Status | Borrower | Loan Amount |
|---|---|---|---|
| Open | Gomes Soccorro | $76,000 |
Source: Public Records
Tax History Compared to Growth
Tax History
| Year | Tax Paid | Tax Assessment Tax Assessment Total Assessment is a certain percentage of the fair market value that is determined by local assessors to be the total taxable value of land and additions on the property. | Land | Improvement |
|---|---|---|---|---|
| 2024 | $4,157 | $59,550 | $9,310 | $50,240 |
| 2023 | $4,157 | $59,550 | $9,310 | $50,240 |
| 2022 | $3,619 | $43,980 | $6,900 | $37,080 |
| 2021 | $3,414 | $43,980 | $6,900 | $37,080 |
| 2020 | $3,357 | $43,980 | $6,900 | $37,080 |
| 2019 | $2,902 | $34,400 | $6,900 | $27,500 |
| 2018 | $2,881 | $34,400 | $6,900 | $27,500 |
| 2017 | $2,864 | $34,400 | $6,900 | $27,500 |
| 2016 | $2,600 | $29,920 | $6,900 | $23,020 |
| 2015 | $2,556 | $29,920 | $6,900 | $23,020 |
| 2014 | $2,556 | $29,920 | $6,900 | $23,020 |
| 2012 | -- | $35,760 | $10,780 | $24,980 |
Source: Public Records
Map
Nearby Homes
- 7806 Washington Park Dr
- 2207 Southlea Dr
- 2334 Mardell Dr
- 1817 Provincetown Rd
- 1901 Washington Dr N
- 1943 Washington South Dr Unit 1943
- 2560 Delavan Dr
- 1200 Captains Bridge
- 1553 Roamont Dr
- 488 Crossing Ln
- 550 Crossing Ln
- 1931 Alda Ct
- 7061 Rivendell Cir
- 3091 Simpson Ct
- 3057 Wellington Ln Unit 8264
- Yeats Plan at Chamberlin Crossing
- Turnbull Plan at Chamberlin Crossing
- 3052 Simpson Ct
- 3052 Simpson Ct Unit 8337
- 3091 Simpson Ct Unit 8355
- 7918 Washington Park Dr
- 7930 Washington Park Dr
- 7912 Washington Park Dr
- 7936 Washington Park Dr
- 2151 Miamisburg Centerville Rd
- 7942 Washington Park Dr
- 7925 Washington Park Dr
- 7919 Washington Park Dr
- 7906 Washington Park Dr
- 7931 Washington Park Dr
- 7913 Washington Park Dr
- 2205 Miamisburg Centerville Rd
- 7937 Washington Park Dr
- 7905 Washington Park Dr
- 7948 Washington Park Dr
- 7900 Washington Park Dr
- 7943 Washington Park Dr
- 7954 Washington Park Dr
- 7823 Washington Park Dr
- 7830 Washington Park Dr