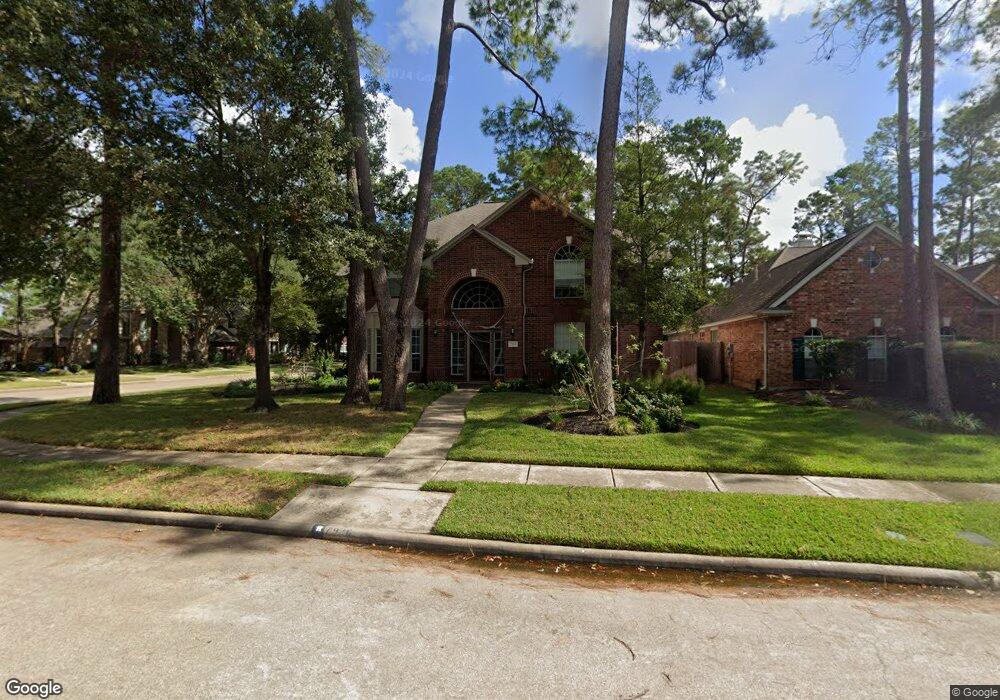
7926 Scherzo Ln Houston, TX 77040
Brookhollow West NeighborhoodEstimated Value: $484,010 - $540,000
4
Beds
3
Baths
3,592
Sq Ft
$142/Sq Ft
Est. Value
About This Home
This home is located at 7926 Scherzo Ln, Houston, TX 77040 and is currently estimated at $511,003, approximately $142 per square foot. 7926 Scherzo Ln is a home located in Harris County with nearby schools including Gleason Elementary School, Cook Middle School, and Jersey Village High School.
Ownership History
Date
Name
Owned For
Owner Type
Purchase Details
Closed on
Mar 6, 2000
Sold by
Touchstone Steve and Touchstone Aimee
Bought by
Mcfadden Lee and Mcfadden Lynch
Current Estimated Value
Home Financials for this Owner
Home Financials are based on the most recent Mortgage that was taken out on this home.
Original Mortgage
$208,000
Outstanding Balance
$68,361
Interest Rate
7.87%
Estimated Equity
$442,642
Purchase Details
Closed on
Oct 28, 1999
Sold by
Jouriles Ernest and Mcdonald Cynthia Renee
Bought by
Touchstone Steve and Touchstone Aimee
Home Financials for this Owner
Home Financials are based on the most recent Mortgage that was taken out on this home.
Original Mortgage
$202,800
Interest Rate
7.75%
Purchase Details
Closed on
Aug 31, 1995
Sold by
Centennial Homes Inc
Bought by
Jouriles Ernest and Mcdonald Cynthia Renee
Home Financials for this Owner
Home Financials are based on the most recent Mortgage that was taken out on this home.
Original Mortgage
$203,150
Interest Rate
7.76%
Create a Home Valuation Report for This Property
The Home Valuation Report is an in-depth analysis detailing your home's value as well as a comparison with similar homes in the area
Home Values in the Area
Average Home Value in this Area
Purchase History
| Date | Buyer | Sale Price | Title Company |
|---|---|---|---|
| Mcfadden Lee | -- | Stewart Title | |
| Touchstone Steve | -- | Stewart Title | |
| Jouriles Ernest | -- | Chicago Title |
Source: Public Records
Mortgage History
| Date | Status | Borrower | Loan Amount |
|---|---|---|---|
| Open | Mcfadden Lee | $208,000 | |
| Previous Owner | Touchstone Steve | $202,800 | |
| Previous Owner | Jouriles Ernest | $203,150 |
Source: Public Records
Tax History Compared to Growth
Tax History
| Year | Tax Paid | Tax Assessment Tax Assessment Total Assessment is a certain percentage of the fair market value that is determined by local assessors to be the total taxable value of land and additions on the property. | Land | Improvement |
|---|---|---|---|---|
| 2025 | $4,553 | $460,802 | $111,126 | $349,676 |
| 2024 | $4,553 | $489,031 | $111,126 | $377,905 |
| 2023 | $4,553 | $482,864 | $111,126 | $371,738 |
| 2022 | $9,910 | $434,649 | $85,397 | $349,252 |
| 2021 | $9,453 | $364,841 | $85,397 | $279,444 |
| 2020 | $10,017 | $377,371 | $74,015 | $303,356 |
| 2019 | $10,535 | $385,113 | $74,015 | $311,098 |
| 2018 | $3,571 | $372,508 | $74,015 | $298,493 |
| 2017 | $10,193 | $372,508 | $74,015 | $298,493 |
| 2016 | $9,776 | $372,508 | $74,015 | $298,493 |
| 2015 | $6,824 | $372,508 | $74,015 | $298,493 |
| 2014 | $6,824 | $313,152 | $56,935 | $256,217 |
Source: Public Records
Map
Nearby Homes
- 8111 Ivan Reid Dr
- 8715 Andante Dr
- 8126 Ivan Reid Dr
- 7714 Rolling Fork Ln
- 9118 Woodwind Lakes Dr
- 7802 Percussion Place
- 9315 Woodwind Lakes Dr
- 7823 Redlands Dr
- 8403 Cienna Dr
- 8302 Country Wind Ln
- 8315 Terrace Wind Dr
- 9427 Fern Wood Forest
- 8418 Westnut Ln
- 7947 Clarion Way
- 7915 Corrian Park Cir
- 8227 Prairie Wind Ln
- 9430 Oratorio Ct
- 8026 Clarion Way
- 7824 Stoneyway Dr
- 7818 Stoneyway Dr
- 7922 Scherzo Ln
- 7918 Scherzo Ln
- 8838 Andante Dr
- 8834 Andante Dr
- 8902 Andante Dr
- 7927 Scherzo Ln
- 7923 Scherzo Ln
- 8830 Andante Dr
- 7914 Scherzo Ln
- 8906 Andante Dr
- 7919 Scherzo Ln
- 8826 Andante Dr
- 8910 Andante Dr
- 7910 Scherzo Ln
- 7915 Scherzo Ln
- 7926 Allegro Dr
- 8822 Andante Dr
- 7922 Allegro Dr
- 8914 Andante Dr
- 7911 Scherzo Ln